Floor & Decor: The NERDIEST Deep-Dive Equity Research Report (Part 2)
A numerical breakdown of FND's sources of historical supergrowth (34% earnings CAGR) - which can be confidently extrapolated to forecast FND's future growth.
Chapters in this Report:

1. AI-gen summary of this report (650 words)

2. FND: 10Y Historical Financial Performance

2. FND’s Comps — A Detailed Breakdown Analysis

3. FND’s Sales Volume Growth — A Detailed Breakdown Analysis

3a. How much of Sales volume growth is attributable to Store count growth vs. Transactions growth (i.e. inorganic vs. organic growth)?

4. <Download FND’s Excel file>
In our previous FND Part 1 report, we saw how FND had an incredible amount of growth before it, and the adequate moats to defend that growth trajectory from competitive pressure or industry disruption (e.g. e-commerce). Charlie Munger likened them to being a wonderful business with Costco’s business model; while I described them as A Brick-and-Mortar Supermarket with SaaS-like ARR and NVDIA-lite Growth.
In this report, we’ll get beyond the juicy skin and bite hard into the meat of the thesis. We will challenge every growth narrative floating around in a professionally skeptical manner, and give their audited historical financial performance a brutal financial teardown — by putting them under the magnifying glass to determine which business factors have historically contributed the most to FND’s mindbending growth, as well as which will likely continue doing so going forward.
At 44x trailing PE, valuations start to become a legitimate concern — but take heart, as numbers don’t lie. This FND report aims to provide readers with the assurance they need to become absolutely confident in financially assessing whether FND’s business moats will remain reliable for years to come — and whether their purported decades-long growth runway can be reliably extrapolated into the foreseeable future. Finally, we’ll wrap up the Valuation exercise in next week’s Part 3.
“Given that FND’s unit growth is both of the organic & healthy variety, reinvestments of their Retained Earnings reliably results in positive FCF — which can subsequently be channeled towards further growth (i.e. cash flywheel). This perpetual energy momentum is only possible due to FND’s outstanding business moats, and organically solves a lot of garden-variety business concerns.“
Check out our previous stock reports:
I want to give a huge shoutout to Alex from The Science of Hitting Substack (TSOH), who very graciously allowed me to lean on his research while analyzing FND. Please visit his newsletter at the link above and show your support to him.
Preview:
FND’s 10Y Historical Financial Performance
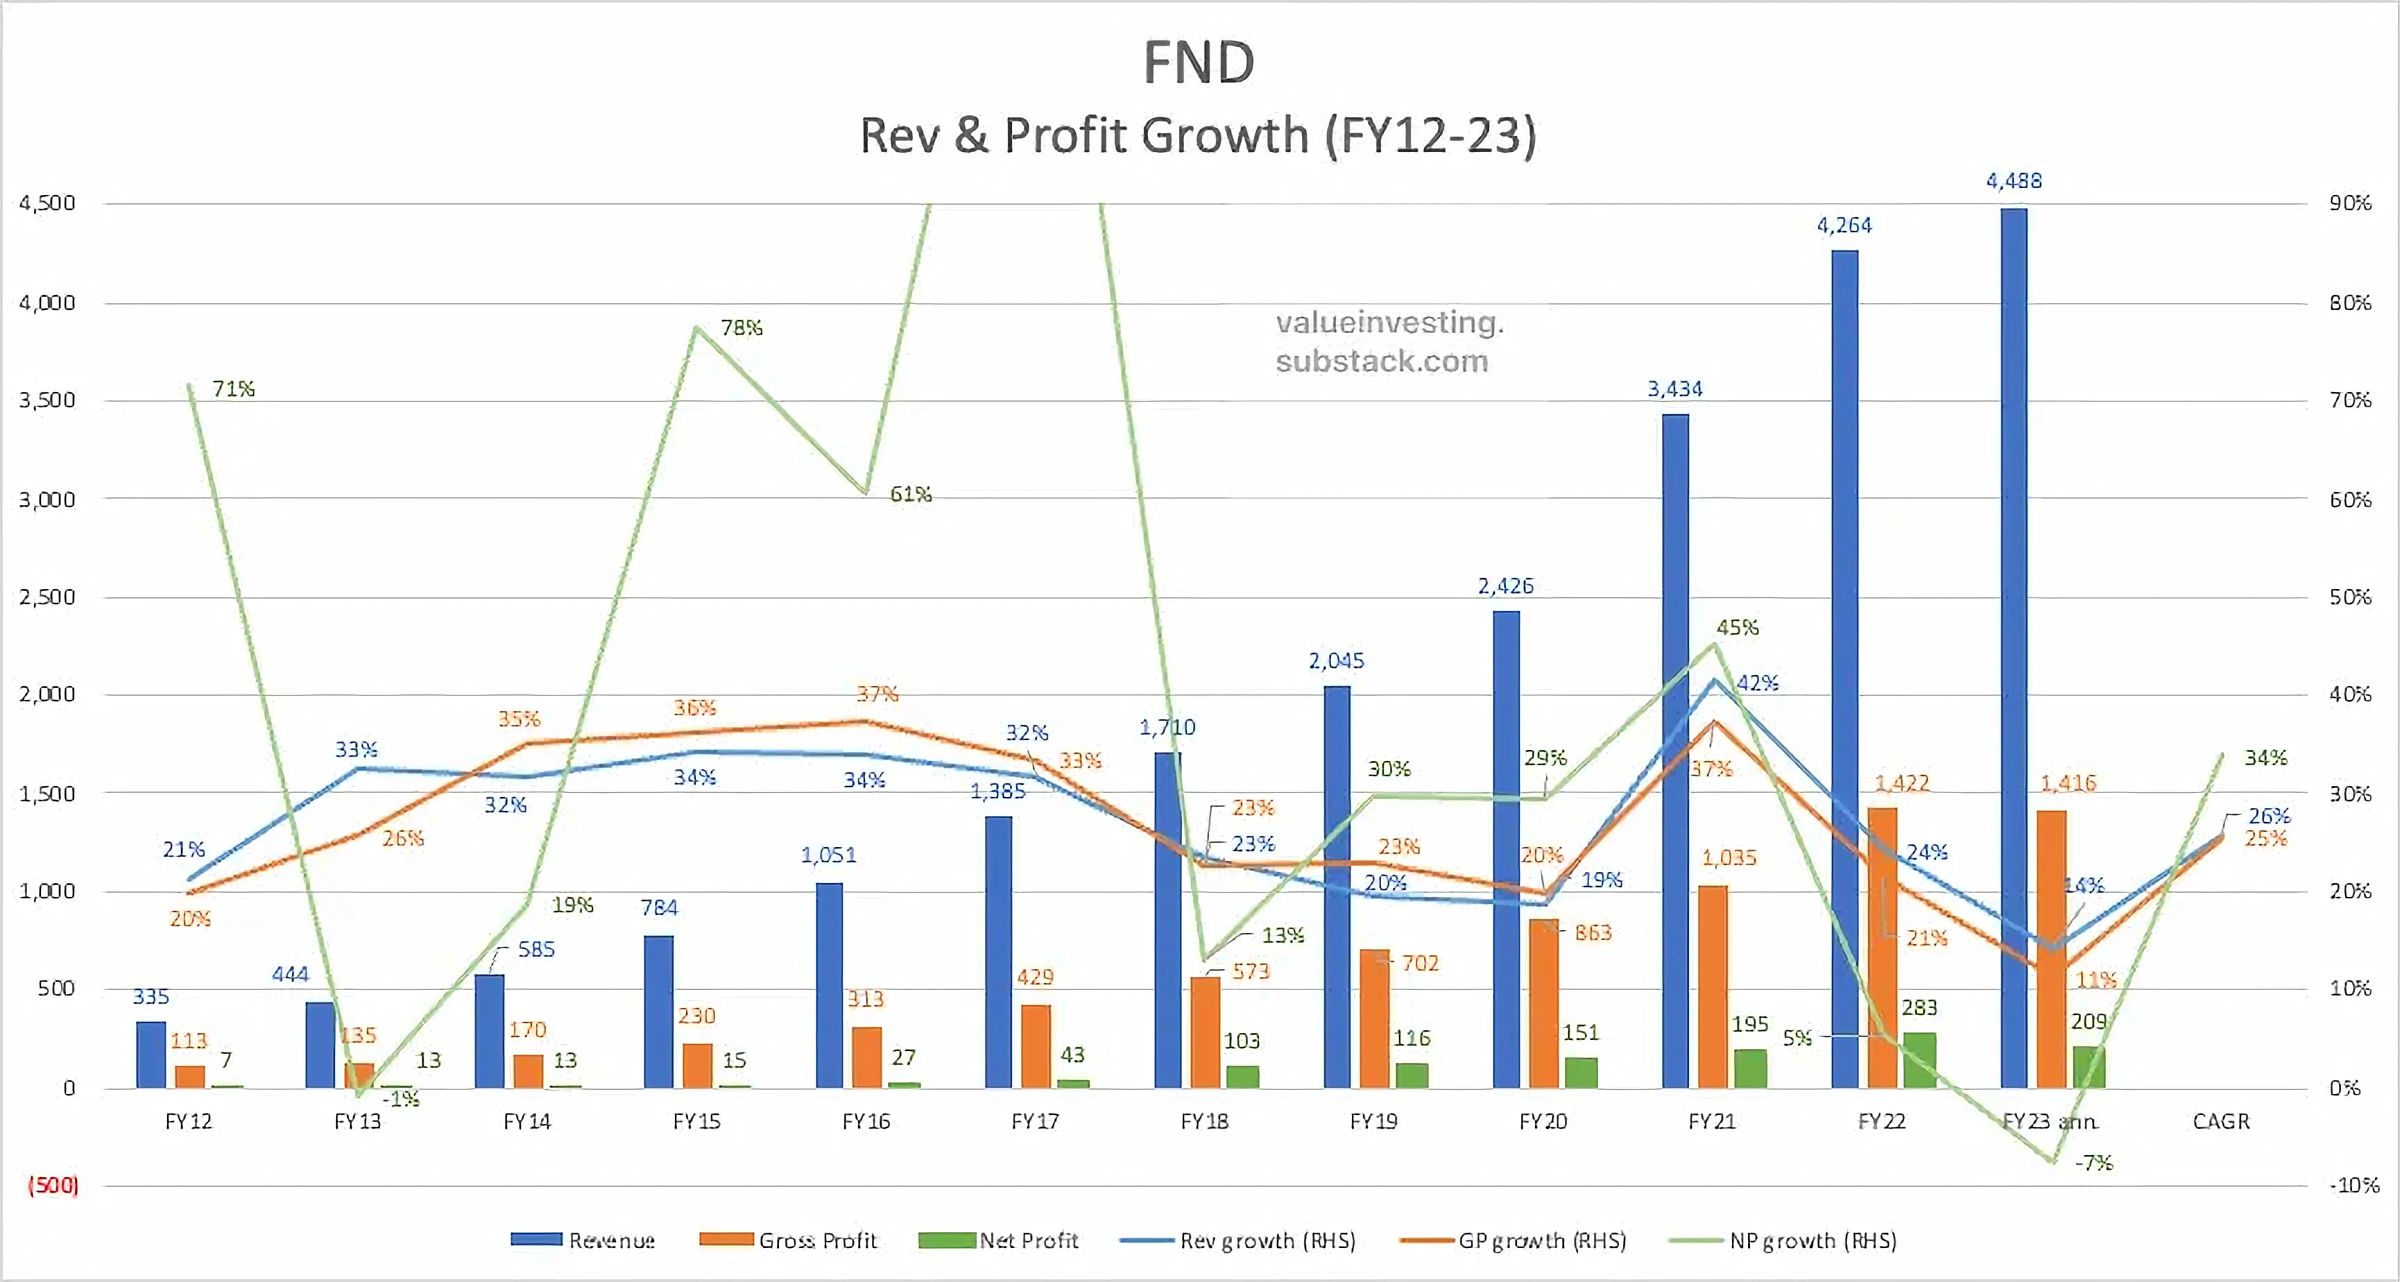
The quickest way to gain insight into FND’s future potential is to build on context regarding its past performance. As we can see in the chart above, FND has posted tremendous growth over the past 10 years. The right side of the chart shows how they’ve grown their Revenues by 26% CAGR (blue line) over the past decade, while their earnings have grown by 34% CAGR (green line).
Even more impressive is not just their absolute growth, but how consistent this growth has been. It’s one thing to have gangbusters growth that is lumpy and volatile (e.g. Tech SaaS); it’s quite another to post consistent 20-30% growth rates over an entire decade. That’s mindboggling performance even for an asset-light Tech business; much less a capital-intensive supermarket that sells flooring products. And we saw in Part 1, they still have plenty of growth runway left over the next 10 years…
In This Article: 4,000 words, 9 charts, 1 Excel file, 25-min reading time
Keep reading with a 7-day free trial
Subscribe to Value Investing for Professionals to keep reading this post and get 7 days of free access to the full post archives.


