

🇲🇾 Malaysia 4Q + FY2022 GDP Review - How Malaysia Achieved One of the Highest FY22 GDP Growth In The World (+8.7%)!!
🇲🇾 Malaysia 4Q + FY2022 GDP Review - How Malaysia Achieved One of the Highest FY22 GDP Growth In The World (+8.7%)!!

All screenshots were sourced from the below Malaysia Q4 2022 GDP report by DOSM:
Fitch Ratings just published their ratings report for Malaysia, affirming the nation with a ‘BBB+’ credit rating. I actually finished writing this report just before they published theirs, and they basically agreed with everything I said. Thanks, Fitch.
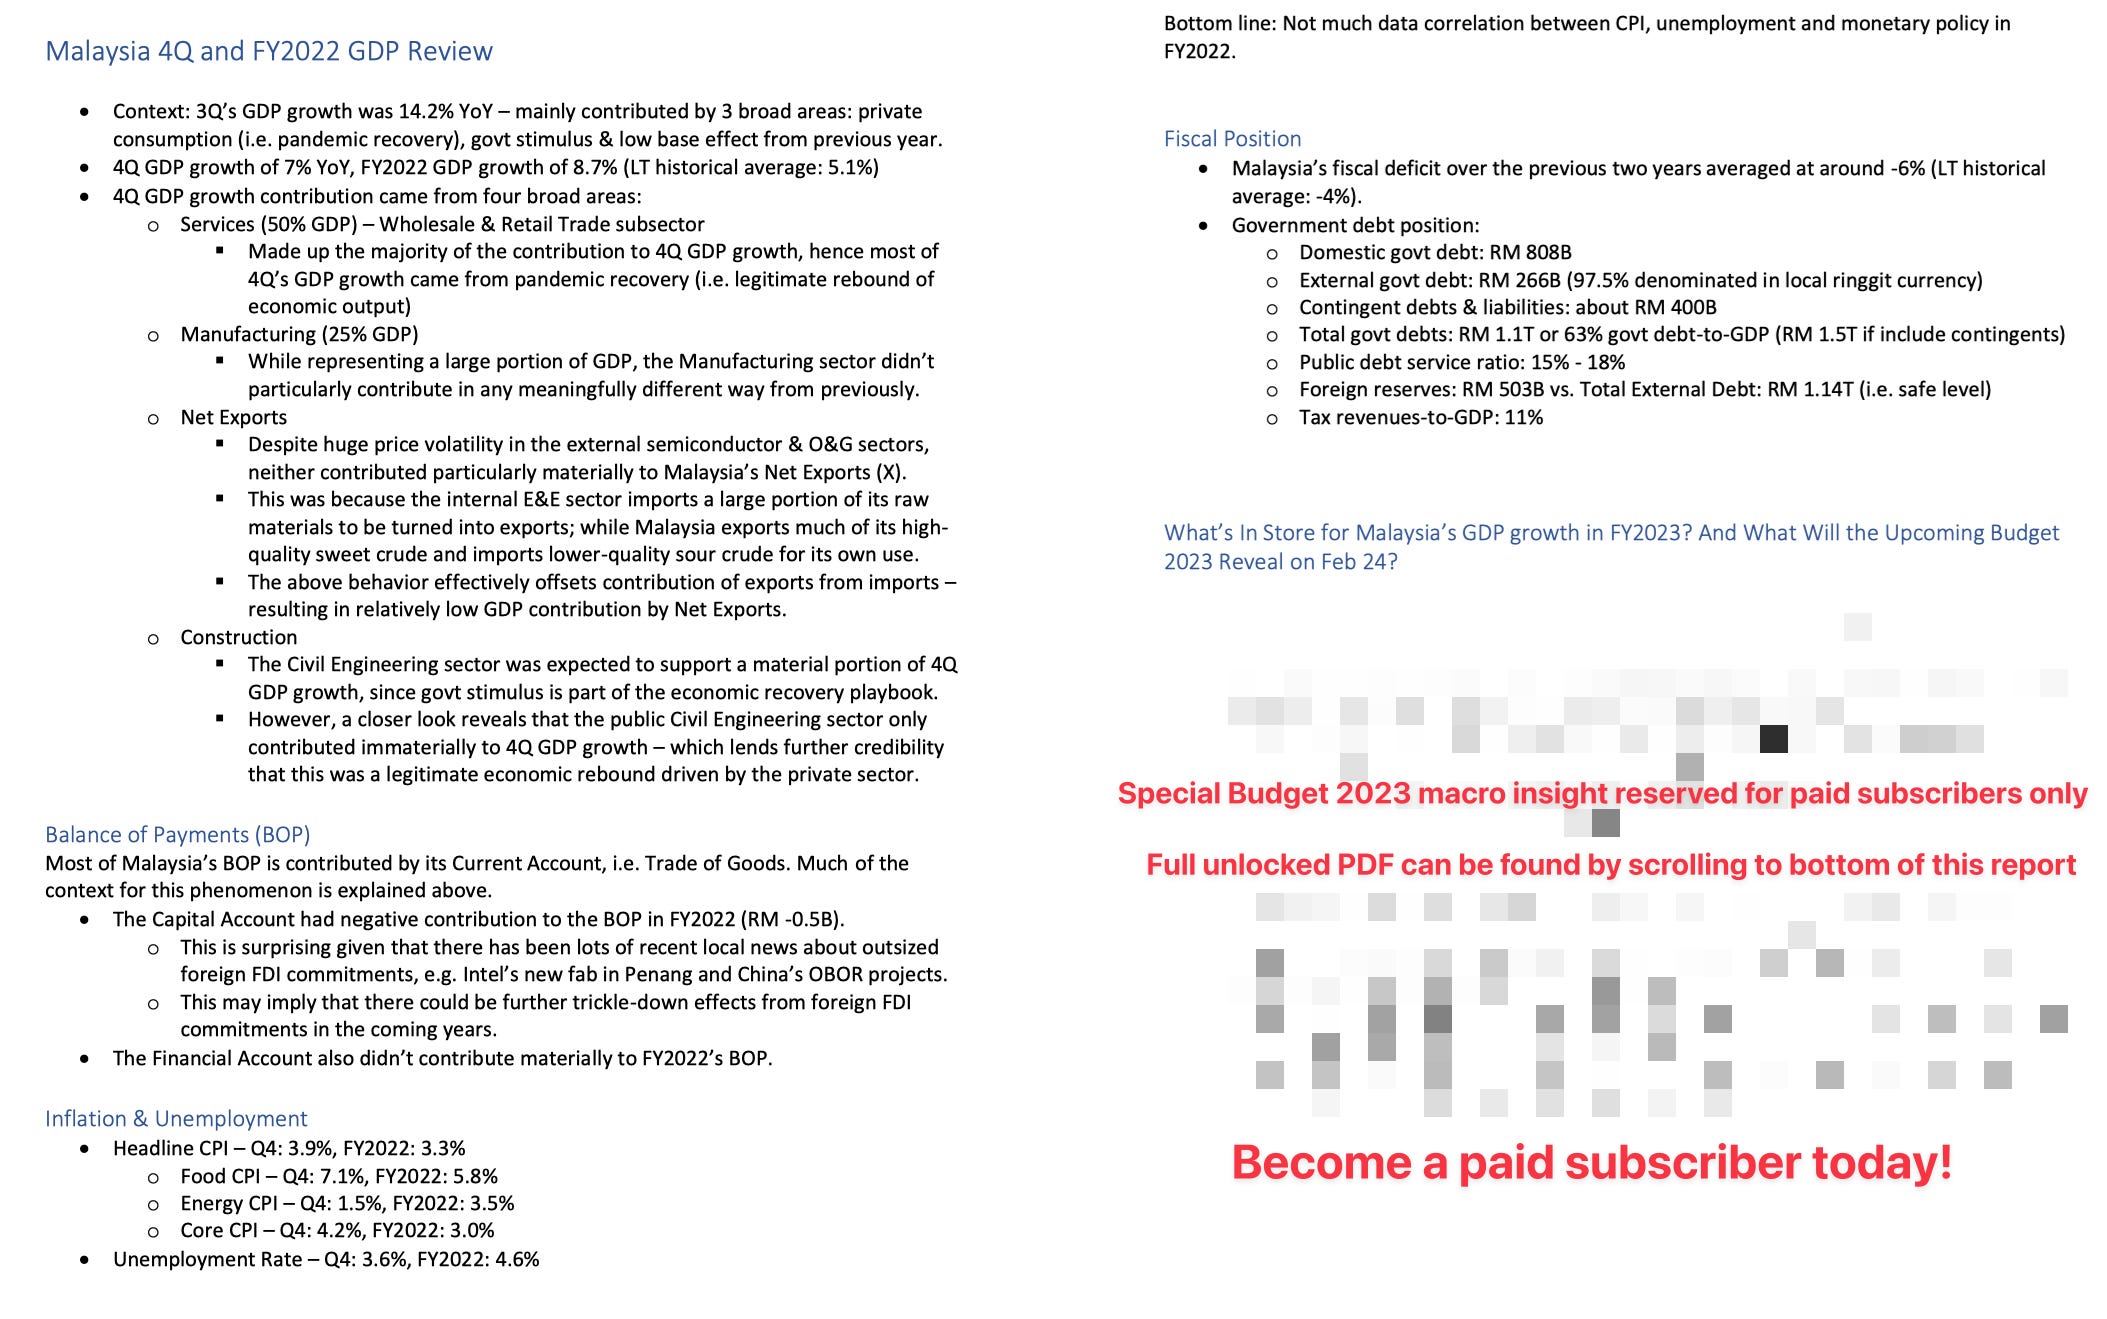
Jokes aside, Malaysia’s GDP growth startled to the upside with a massive +14.2% YoY growth in 3Q22 (previous quarter). The breakdown of this 3Q22 growth could be roughly attributed to three factors: Private Consumption (i.e. pandemic recovery), Govt Stimulus, and a Low base effect from the previous year. Counterintuitively, the low base effect only contributed to roughly 1/3 of that massive +14.2% GDP growth — with the remaining 2/3 seeming to be legitimate growth.
It might also surprise readers to learn that Net Exports (X) didn’t contribute much to 3Q22’s meteoric GDP growth. While Exports did outperform in isolation — given that Malaysia is a large commodities exporter (~25% of exports) and an important E&E upstream supplier to the global semiconductor supply chain (~35% of exports) — Malaysia also had large Imports of raw materials to turn into finished goods for export, resulting in relatively muted 3Q22 GDP contribution by Net Exports.

Malaysia’s GDP growth in the latest quarter (4Q22) surprised to the upside once again, with a solid +7% GDP growth YoY. This brought the country’s full year 2022 GDP growth to +8.7% — in contrast to the country’s LT historical average of +5.1%. Again, part of this was attributable to low base effects — but Malaysia’s 4Q22 GDP has already fully recovered back to its pre-pandemic trend, surpassing 4Q19’s GDP by between 7% - 12% (depending on different estimates).
Given that the local economy had still been affected by the pandemic over the past 18 months — as well as being one of Malaysia’s more political tumultuous times, with 3 different Prime Ministers — an economist would be forgiven for thinking that most of this solid growth resulted from traditional Keynesian stimulus, via government spending in the Industrial sector. And indeed, there has certainly been quite a flurry of activity in this space, including talk of reviving the previously cancelled High Speed Rail as part of China’s One Belt One Road project; Intel’s recent commitment to build a leading-edge fab in Penang; and numerous other highly successful FDI projects which are just too boring to make headlines — e.g. the RM 5B Alliance Steel factory expansion in the new Malaysia-China Kuantan Industrial Park.
Chapters:
What Will Policymakers Likely Do In 2023? And What Will The Upcoming Budget 2023 Reveal on Feb 24? <reserved for paid subscribers>
Download PDF summary of Malaysia 4Q GDP Review <reserved for paid subscribers>


Get the power of Wall Street for FREE
TIKR is the ultimate platform for individual investors who want to make better investing decisions. With powerful financial data and tools for over 100,000 stocks globally, TIKR empowers individuals to find and research compelling stocks with confidence.
· Follow Top Investors: get an inside look at the portfolios of 10,000+ investors to help you find winning stock ideas
· Find the Best Stocks: screen through 100,000+ stocks with thousands of filters to find the hidden gems with the highest returns potential
· Quickly Analyze Businesses: easily analyze and chart detailed financial data, ratios, valuations, and Wall Street analyst forecasts
· Monitor Your Portfolio: track upcoming events, news, earnings & conference transcripts, and company filings through a powerful watchlist newsfeed
Click HERE to Sign Up for Free Today (No Credit Card Required)
The Value Investing Substack Portfolio Outperformed The S&P500 By Over +16.6% In 2022! Click the link below to find out more!


Breakdown of Malaysia 4Q GDP growth
However, a quick look at the breakdown of sector contribution reveals that government stimulus wasn’t the key contributor to FY22’s GDP growth. For context, Malaysia’s GDP composition can be eyeballed to be mostly made up of the Services sector (>50%) — with the Manufacturing sector taking 2nd place (25%), and everything else making up the remainder. It is not surprising then to find that most of 4Q’s GDP contribution came from the Services and Manufacturing sectors — however, what is surprising are the sub-sectors within them which contributed to that growth.


Most of 4Q’s Services growth came from the outsized Wholesale & Retail Trade segment, which made up >75% of the Services sector. This is basically a pandemic recovery story driven by rebounding Private Consumption, where the animal spirits of consumer sentiment have recovered. Given that Services represents >50% of Malaysia’s GDP, we shall see later why this sector is instrumental to future sustainable growth in 2023 and beyond.
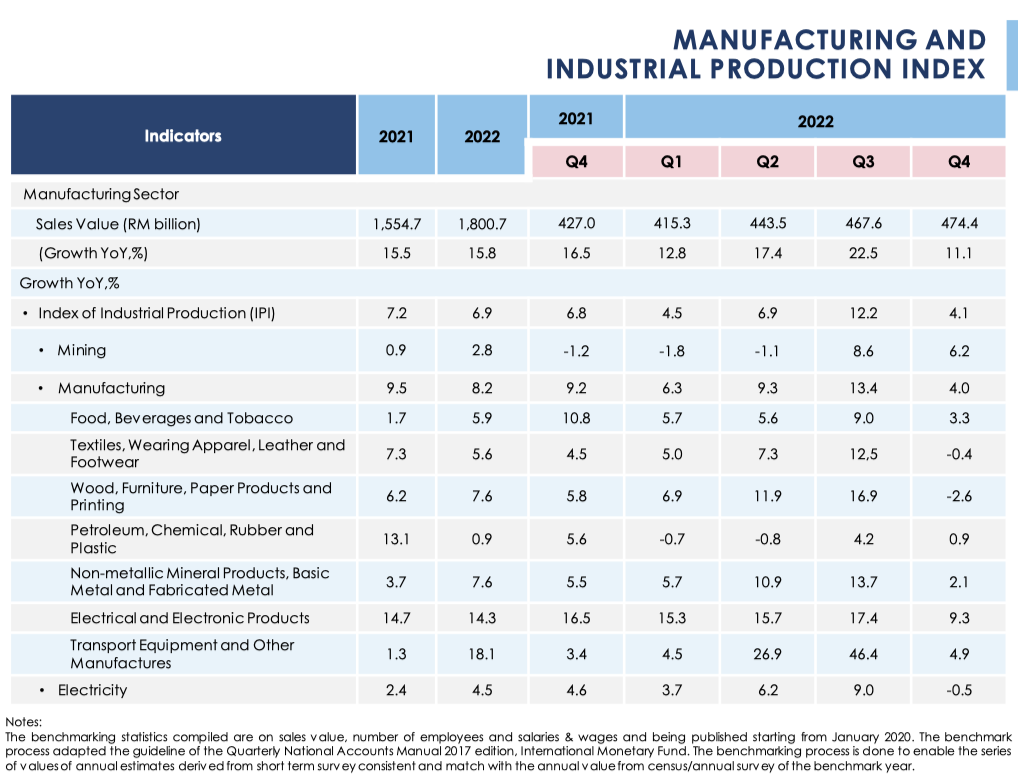
Moving on, we come to Malaysia’s second biggest sector — the Manufacturing sector. While this sector did indeed post an impressive 4Q growth of +11.1% YoY, its absolute contribution to wider 4Q GDP growth wasn’t nearly as material as that of the Services sector — especially when you consider that the country’s Manufacturing sector is intricately linked with economic output from Net Exports, thus diminishing its contribution. This is relevant because much of Malaysia’s Imports are actually raw materials used in the production of finished goods which later become Exports — so there is a direct correlation between exports & imports in the GDP contribution from Net Exports (see table below).
Going back to the table above for a bit, we can also observe that the E&E subsector is the country’s largest Manufacturing segment — which ties into the above narrative, since the E&E subsector is by far Malaysia’s largest export segment (at ~35% of total exports). Much of this can be attributed to semiconductor testing equipment in the trailing-edge space, where the state of Penang controls 7% of global TAM.
Click the box below to read my stock report about the HK-listed Pentamaster based in Penang!

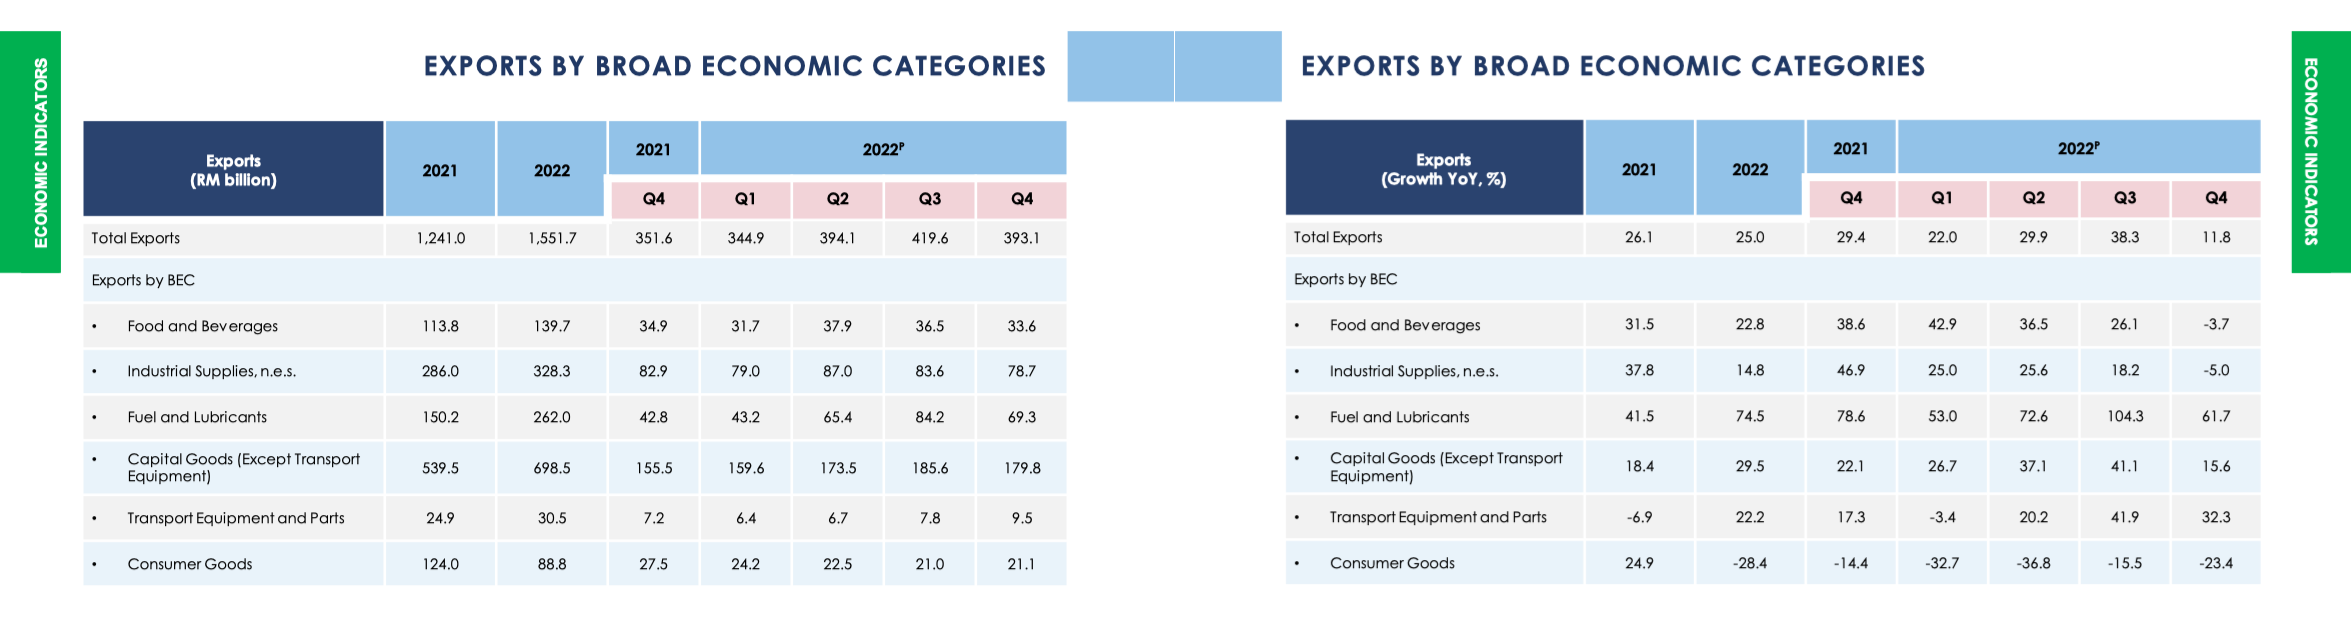
Moving on to the two largest contributors to our Current Account surplus — the E&E sector and the O&G sector. As we have noted above, much of Malaysia’s Imports are raw materials used to produce finished goods for Exports — with most such activity taking place in the local E&E sector. Growth in the local E&E sector has been especially promising recently — anecdotally, channel checks revealed that senior-level employees in the sector were being poached by competitors once every two years, due to lack of supply of talent!
What is perhaps more startling — or maybe not startling at all, given the geopolitical backdrop — is that the Liquified Natural Gas (LNG), Refined Petroleum Product (petrol) and Crude Petroleum (crude oil) sectors have pierced the stratosphere in FY2022 with YoY growth in excess of +60% - 80%! However, this voluminous growth is partly offset by the +514.5% YoY growth of Imports of Crude Petroleum — which actually makes sense once you have the right context. Malaysia actually produces a lot of high-quality sweet crude within its borders — but the government profits from a spread by selling the expensive sweet crude it produces locally to foreigners, and importing cheaper sour crude from abroad to refine and use at home.
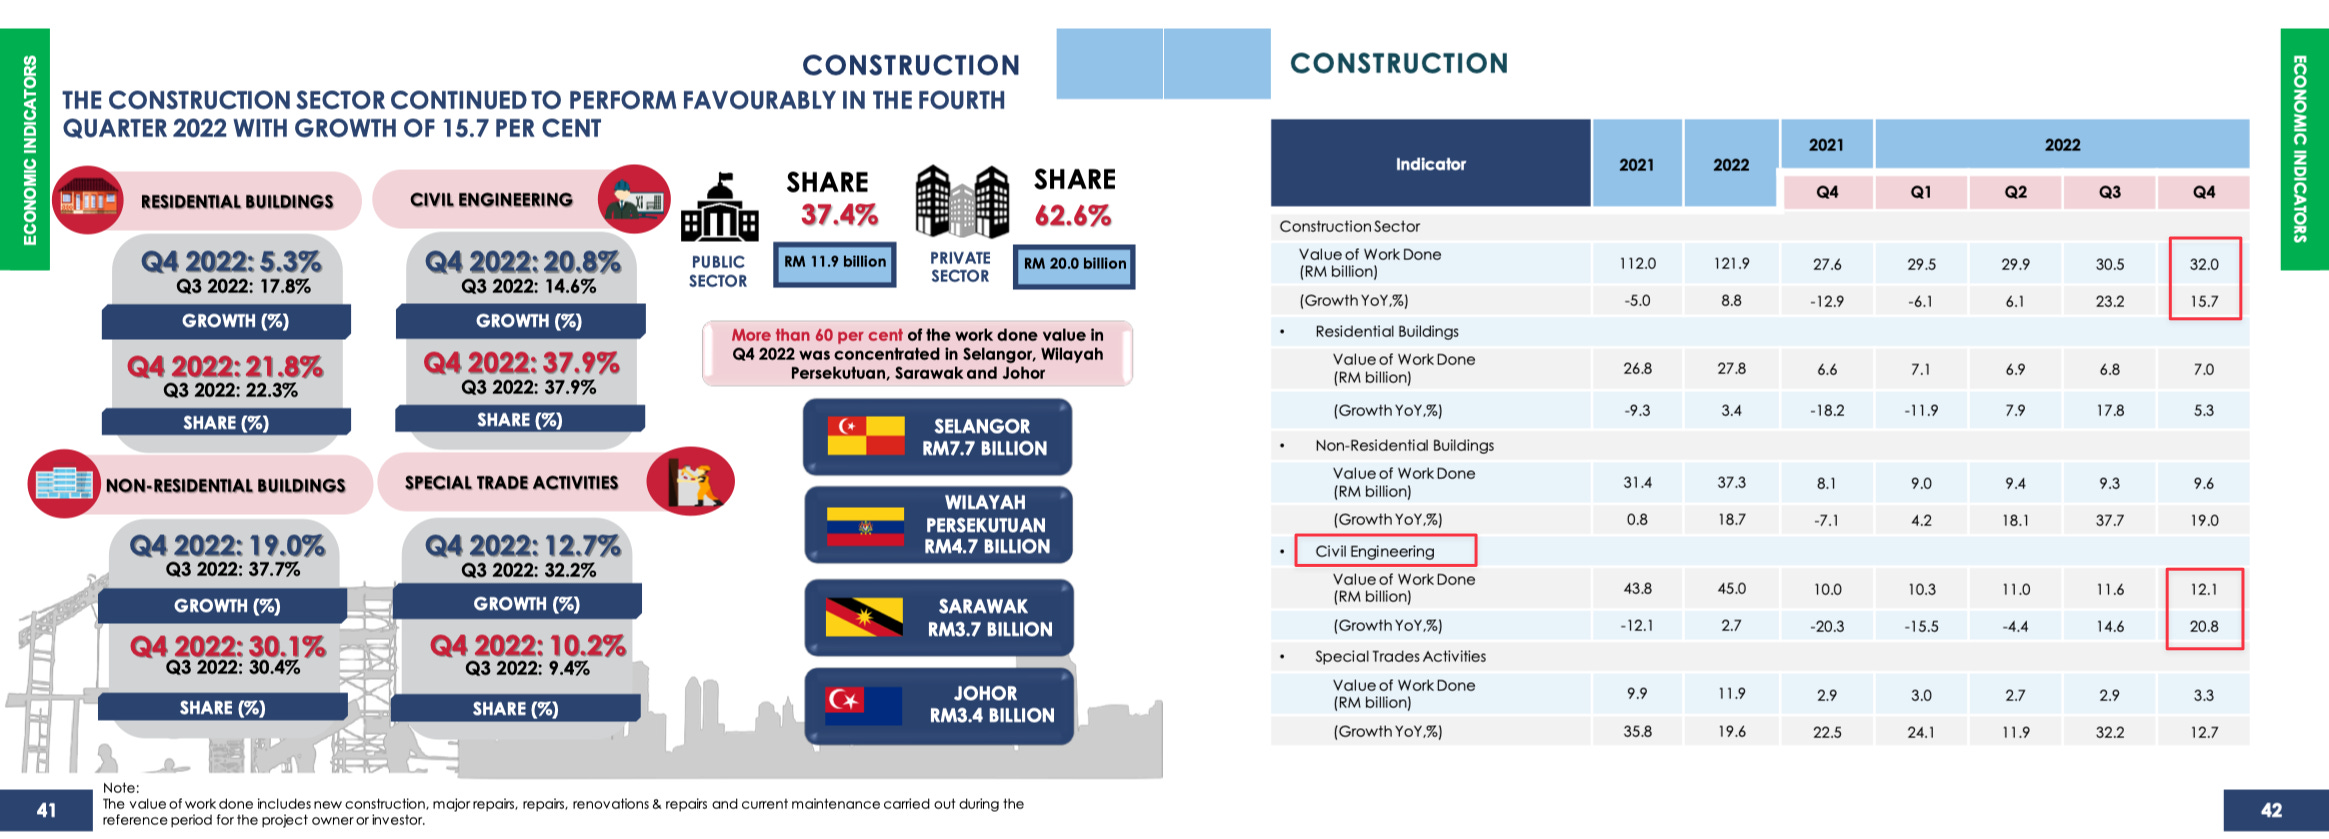
Finally we get to the Construction sector. As mentioned above, most economists would have expected much of the country’s FY22’s +8.7% GDP growth to have come from the government implementing a Keynesian stimulus playbook — which would have seen outsized government investment activity (i.e. ‘G’) taking place under the Civil Engineering subsector. Macro analysts who follow this region should also be familiar with local One Belt One Road activity which have made headlines recently, much of which should have contributed to the Civil Engineering subsector as well (e.g. ECRL development).
While that has more or less been true for FY2022, there are two caveats. Firstly, while the Civil Engineering subsector has certainly contributed materially to the wider Construction sector, its contribution barely moves the needle in the context of wider GDP growth relative to the aforementioned larger Services, Manufacturing and Exports sectors. Hence, it wouldn’t exactly be accurate to say that Keynesian stimulus contributed significantly to wider 4Q GDP growth. Rather, it would seem that this was actually a legitimate economic recovery from pandemic-induced lows.
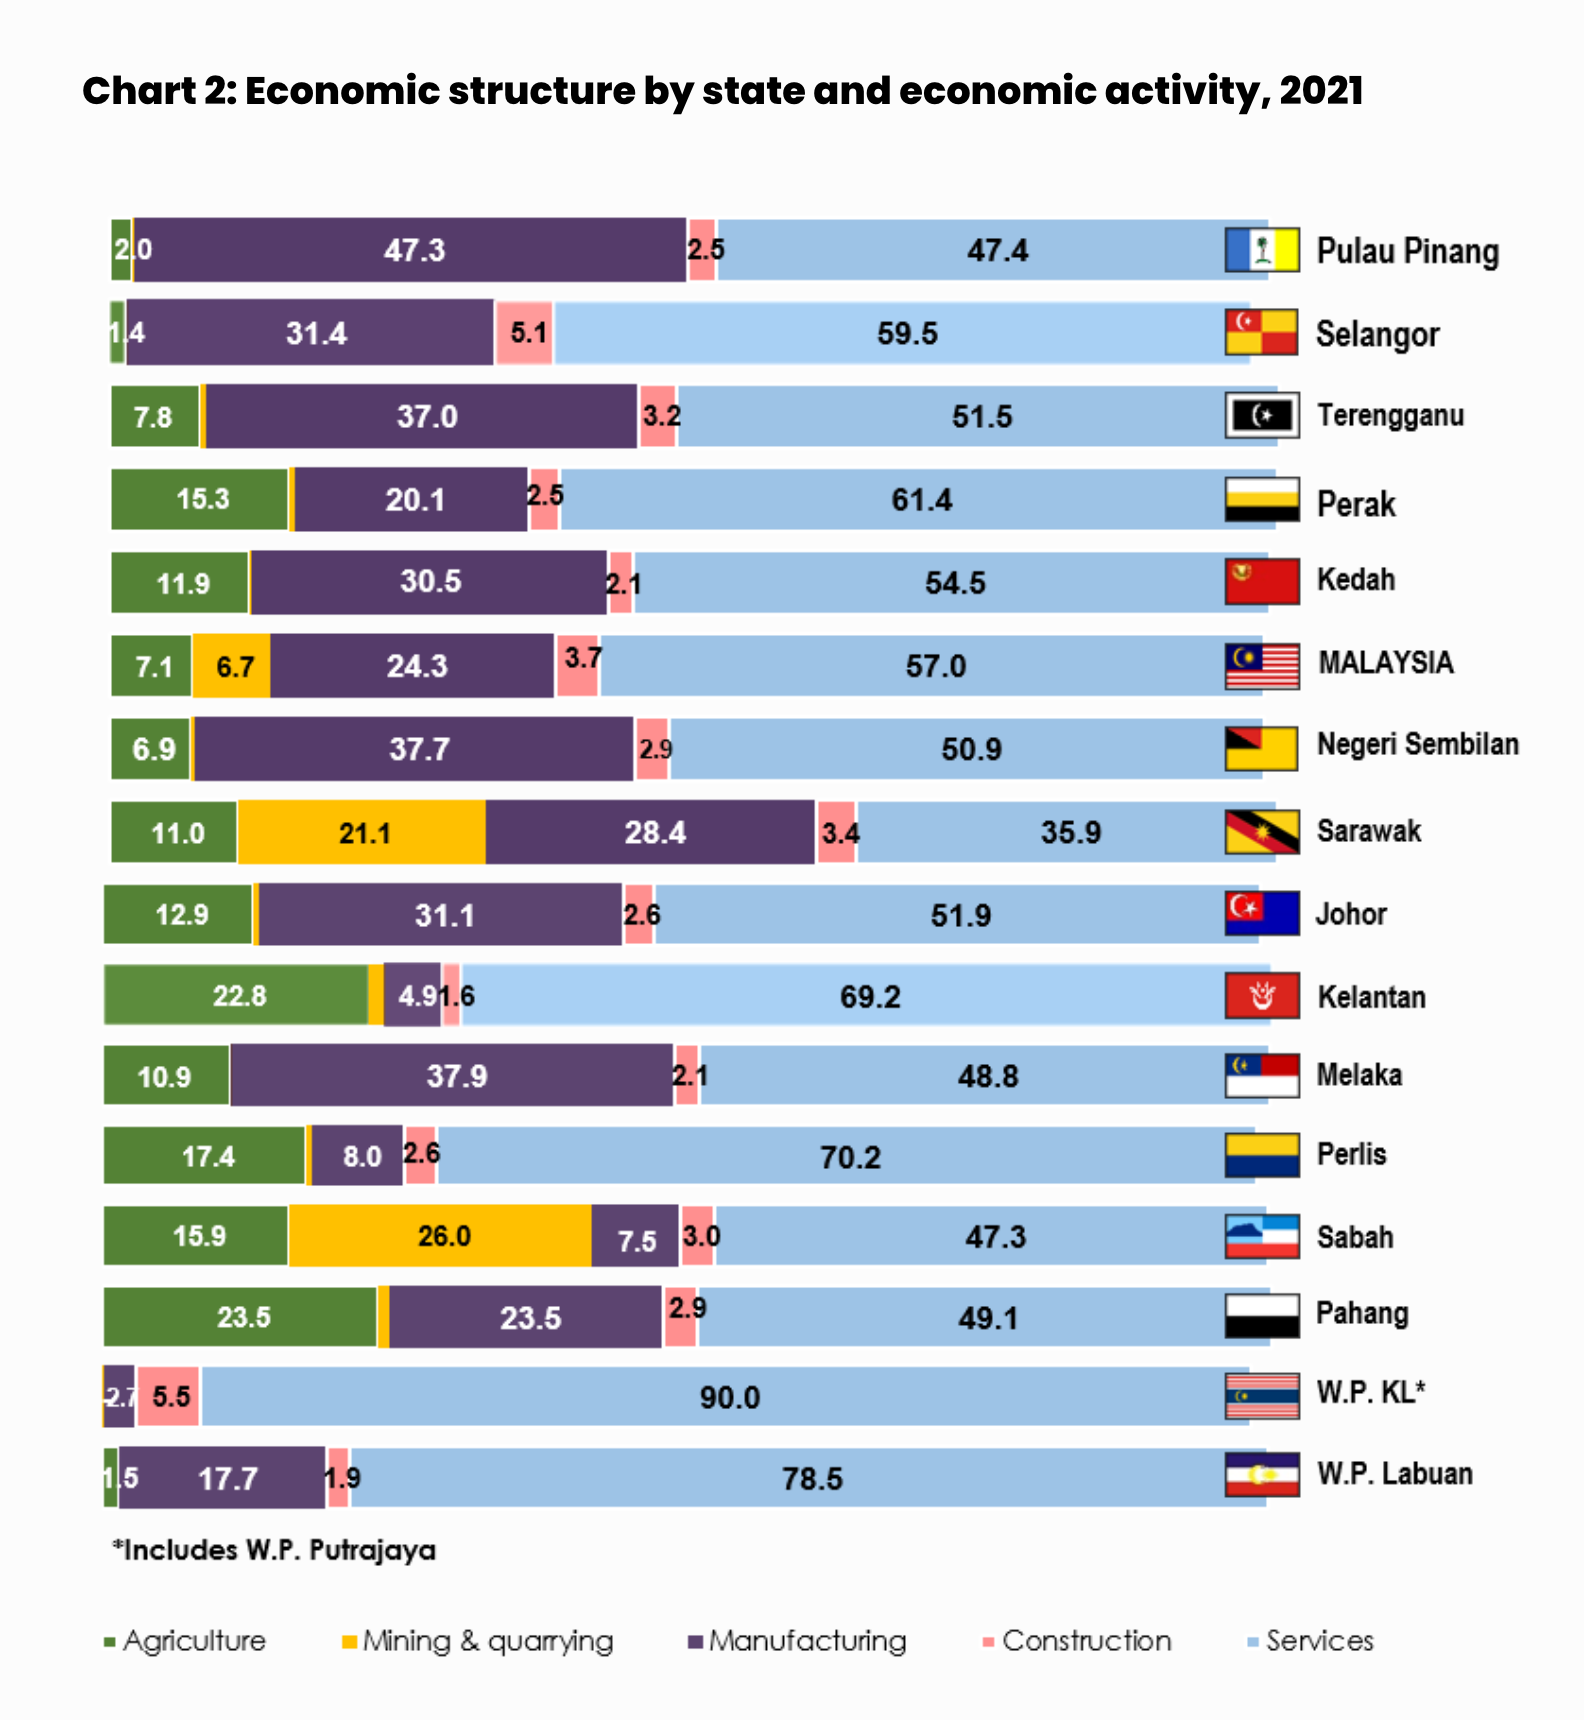
Secondly, the left page of the screenshot above mentions that “more than 60 per cent of the work done value(d) in Q4 2022 was concentrated in Selangor, Wilayah Persekutuan, Sarawak and Johor”. While the latter two states do qualify as largely industrial-driven state economies which could potentially have absorbed a lot of Civil Engineering work in Q4, the former two states (which contributed even more to Q4’s Construction sector) are not known for being industrial-driven state economies. Hence, it would appear that most of the Civil Engineering work might have actually been done by the private sector instead — putting another nail in the coffin for the possibility that most of Q4 and FY2022’s GDP growth was derived from Keynesian government stimulus. Obviously this is all conjecture, but the data does seem to lean that way.
The sum of all this is that it would seem that the Services sector — and by extension, the Wholesale & Retail Trade subsector — has done most of the heavy lifting in uplifting Malaysia’s 4Q and FY2022 GDP growth. This appears to be a legitimate private sector recovery — not a government stimulus-led recovery. Of course, it needs to be recognized that there may have been lagging contributory effects from government stimulus in previous quarters, and that multiplier effects of such stimulus may be hidden from headline-level statistics (e.g. petrol subsidies reduces inflation). However, I think it is safe to say that Malaysia’s economy has already taken its first step into post-pandemic territory, and is well on the way to resuming its pre-pandemic trajectory as an isolated concern.
Balance of Payments
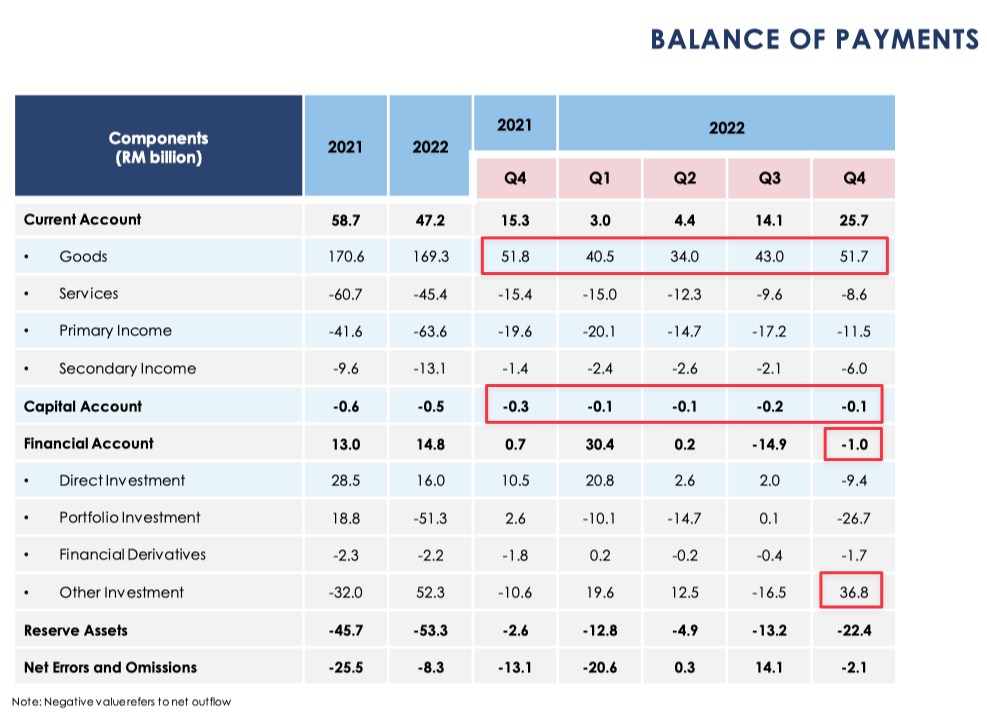
As we can see from the Balance of Payments (BOP) table above, most of Malaysia’s 4Q and FY2022’s Current Account surplus came from Trade of Goods. This is quite normal, as Malaysia is an emerging economy situated in the Manufacturing stage of its economic development lifecycle. As Noahpinion points out in his excellent article, Malaysia is actually one of the more sterling examples of an emerging economy which successfully implemented a vertically-integrated “chaebol” economic model to become an OEM powerhouse — by manufacturing low-value added goods for export to more developed foreign economies as part of a globalized value chain. For context, this is a very similar development model as Poland — and Malaysia is notably just a few years away from crossing the threshold of becoming a high-income nation, with an annual income of USD 30,000 per capita:

Given this Trade of Goods context, it is understandable that the remaining components of Malaysia’s Current Account did not contribute significantly to its Q4 GDP growth. Notably, Q4’s Primary Income was still in the red despite the Q4 Current Account being quite significantly in the black. Primary Income can be roughly likened to the “profit” element (i.e. exchanges with economic value added) of the Current Account — hence an approximate business model interpretation would be that Malaysia was slightly loss-making in 4Q but had decent cash flow.
Interestingly, the Capital Account barely contributed to both Malaysia’s 4Q and FY2022 BOP, as we can see from the above table. Given the flurry of recent news about foreign FDI commitments in the country, one would have thought that the Capital Account would have been a significant contributor to 4Q GDP. Apparently not so! This is a good thing, because it means that those reported FDI commitments should continue to contribute to Malaysia’s BOP in the coming years.
Similarly, there’s hasn’t been any particularly noteworthy contribution from the Financial Account in Q4, except for some eye-popping numbers which ultimately don’t mean much. In essence, Malaysia’s positive BOP situation in both 4Q and FY2022 is really just a Trade of Goods story.
Fiscal Position
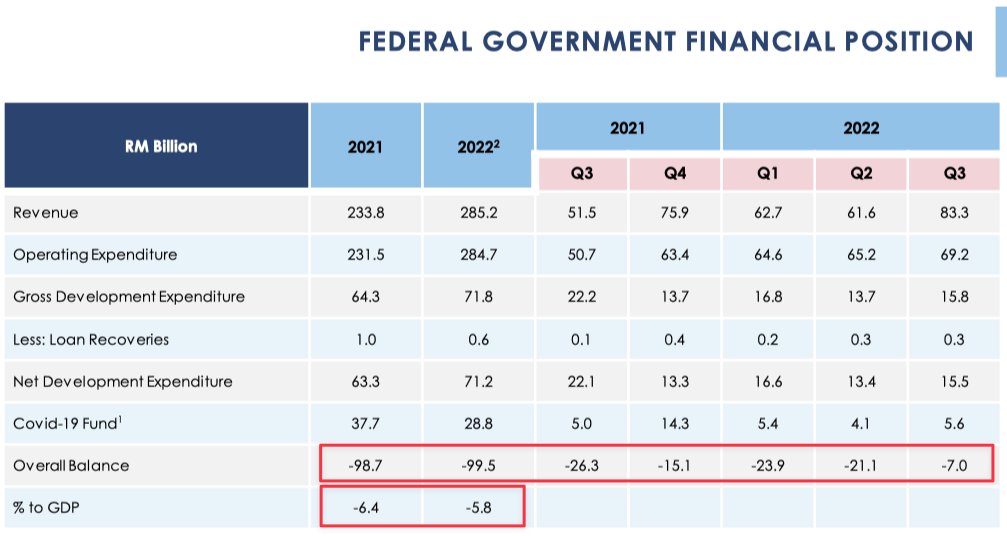
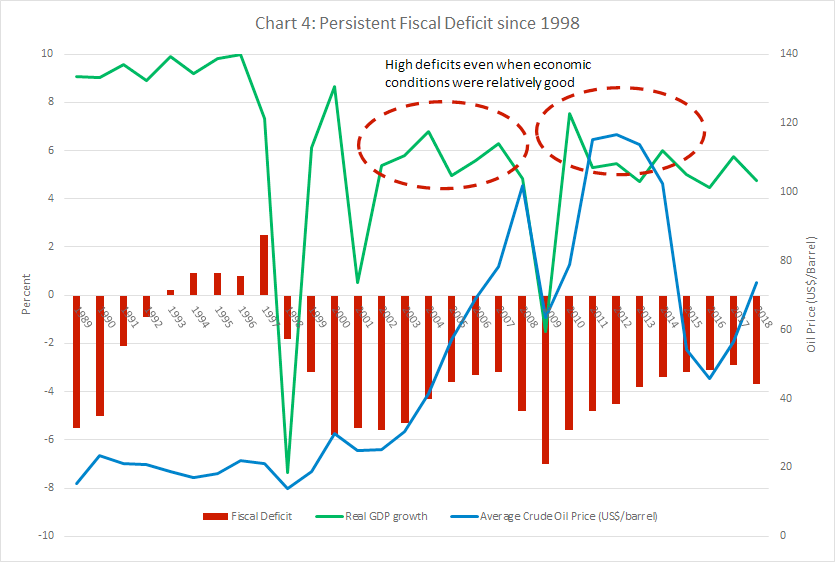
This brings us to Malaysia’s fiscal position. If we look at the tables above, we can observe that Malaysia’s fiscal deficit averaged at around -6% for the years FY2021 and FY2022. This was not particularly debilitating given the right context — the chart below (which was taken from this excellent article) shows that Malaysia has sported an average fiscal deficit of about -4% for most of the past two decades. While this is definitely not sustainable fiscal behavior over the long-term, most of the recent macro squawking over Malaysia’s debt-laden fiscal position has been slightly overdone in my view — as there is no urgent credit time bomb waiting in the wings to explode.
As of Aug 2022, 97.5% of Malaysia’s external government debt was denominated in the local Ringgit currency — hence Malaysia is not going to go the way of Sri Lanka anytime soon. The Malaysian government’s conservative reliance on foreign denominated debt today is largely due to lessons learned during both the 1980’s yen-denominated debt-fueled Look East industrial policy — and the similarly foreign debt-engorged Asian Financial Crisis in the late ‘90’s.
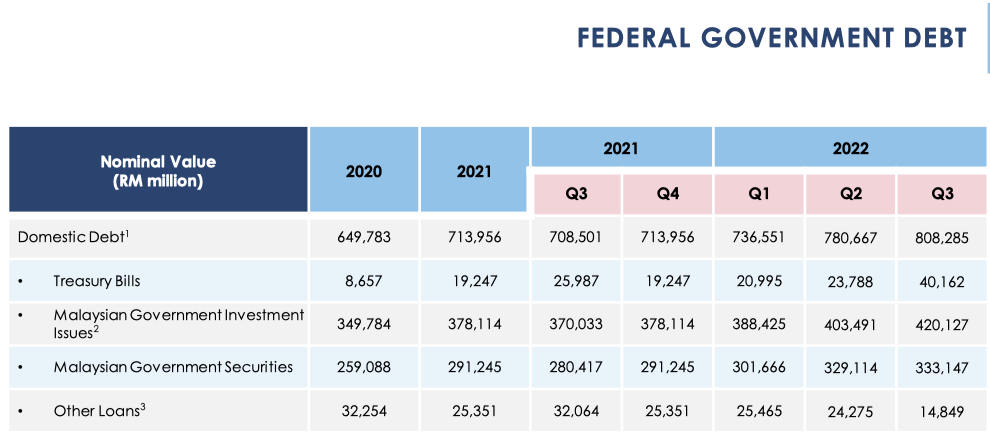
This is not to say that Malaysia is out of the fiscal woods yet. According to the present-day Anwar administration’s interpretation, Malaysia’s government debt has ballooned to a whopping RM 1.5T — in contrast to the above table’s official domestic debt reporting of “merely” RM 808B. If we were to include the public external debt of RM 266B to the aforementioned domestic debt figure, that still brings us to “only” a total debt of roughly RM 1.1T (~63% gross debt-to-GDP). The remaining RM 400B pertains mostly to government guarantees of contingent debt, such as liabilities related to the 1MDB saga.
Malaysia’s government also has a public debt service ratio of ~15% - 18%, which is obviously not great when your currency isn’t a global reserve currency — but is pretty understandable in the context of the recent pandemic, as well as relative to the public debt service ratios of most developed economies.
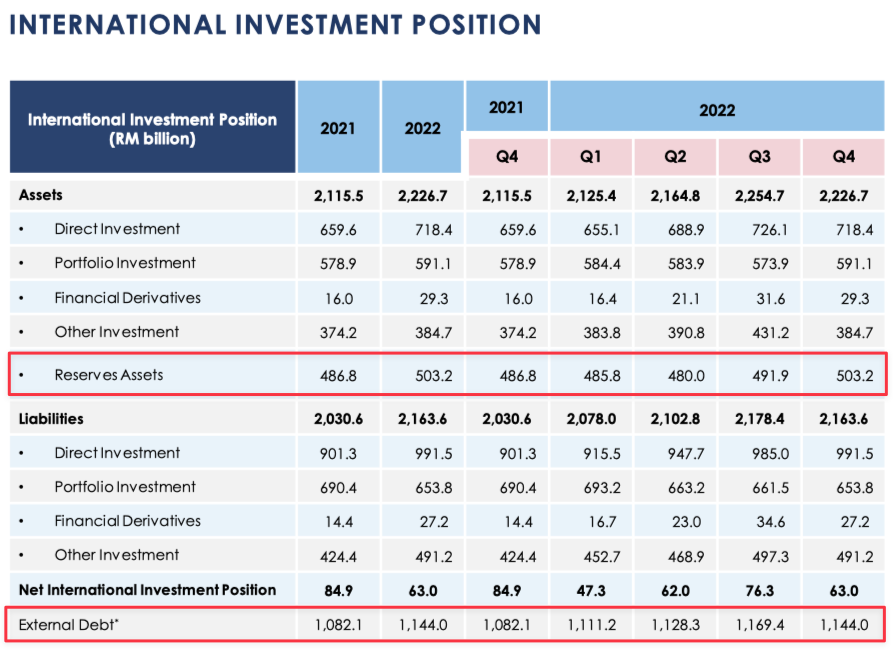
Lastly, we can see from the chart above that Malaysia’s foreign reserves of RM 503.2B stands at roughly half of its External Debt — which is more or less sufficient to defend the currency against short-term speculative volatility. To clarify, this latest Q4 External Debt figure of RM 1.14T pertains to all external debt (households, businesses and government) — not just government external debt alone — and is the correct contrast to draw against the sufficiency of the central bank’s foreign reserves.
Inflation & Unemployment
Unlike much of the developed world, emerging markets like Malaysia have been relatively insulated from the rampant global hyperinflation narrative that has permeated news headlines for the past 12 months. This is due to a combination of three broad reasons: 1) higher EM nominal productivity offsetting inflation; 2) large degrees of fiscal remedies implemented to cap inflation; and 3) larger GDP exposure to China, where inflation has been relatively muted for most of the past year due to their zero-covid policy. Surprisingly, monetary policy did not contribute significantly to stemming inflation fears in Malaysia — given that the country’s policy rate had only increased by roughly +100 bps since the Ukraine War began.
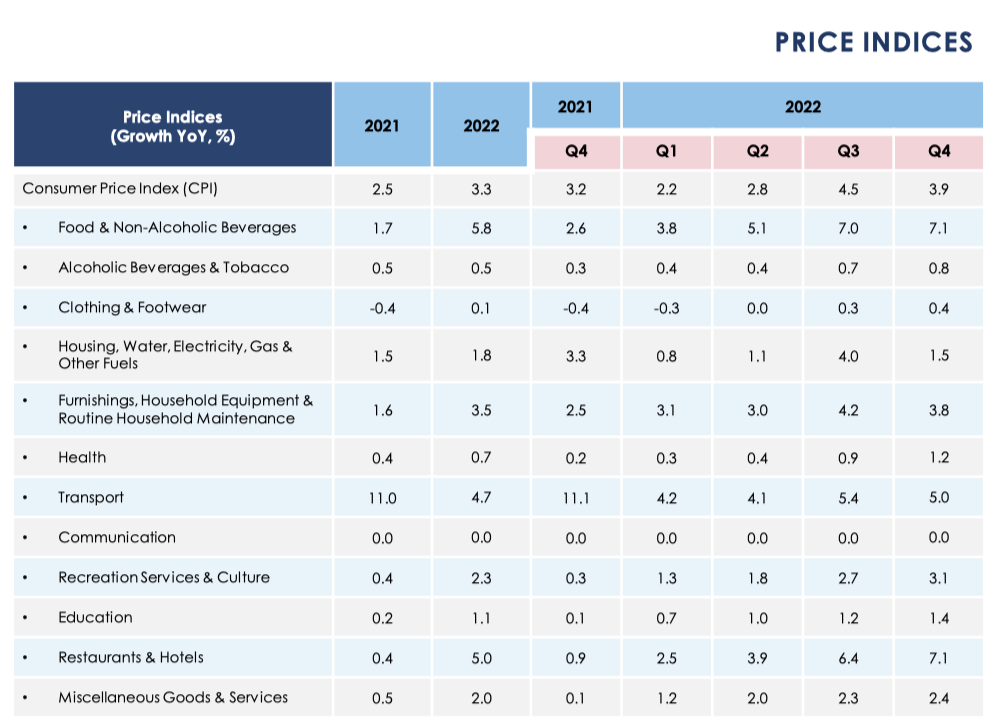
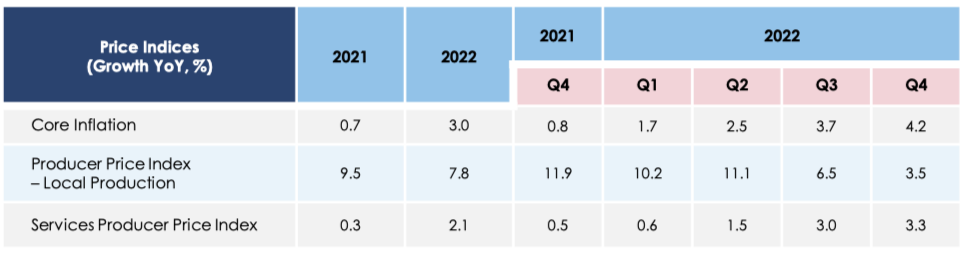
We can observe from the table above that Headline CPI (+3.3%) has actually been relatively stable throughout both FY2021 and FY2022 — with Core Inflation (+3.0%) actually making up most of Headline CPI. Given that global inflation news over the past year has been dominated by the non-core elements (i.e. Food + Energy), it was quite refreshing to note that neither contributed to Malaysia’s Headline CPI in any particularly onerous manner. Even though Food Inflation did ramp up quite significantly in Malaysia throughout FY2022 (+5.8%), its relative contribution to Headline CPI wasn’t particularly larger than Core Inflation.
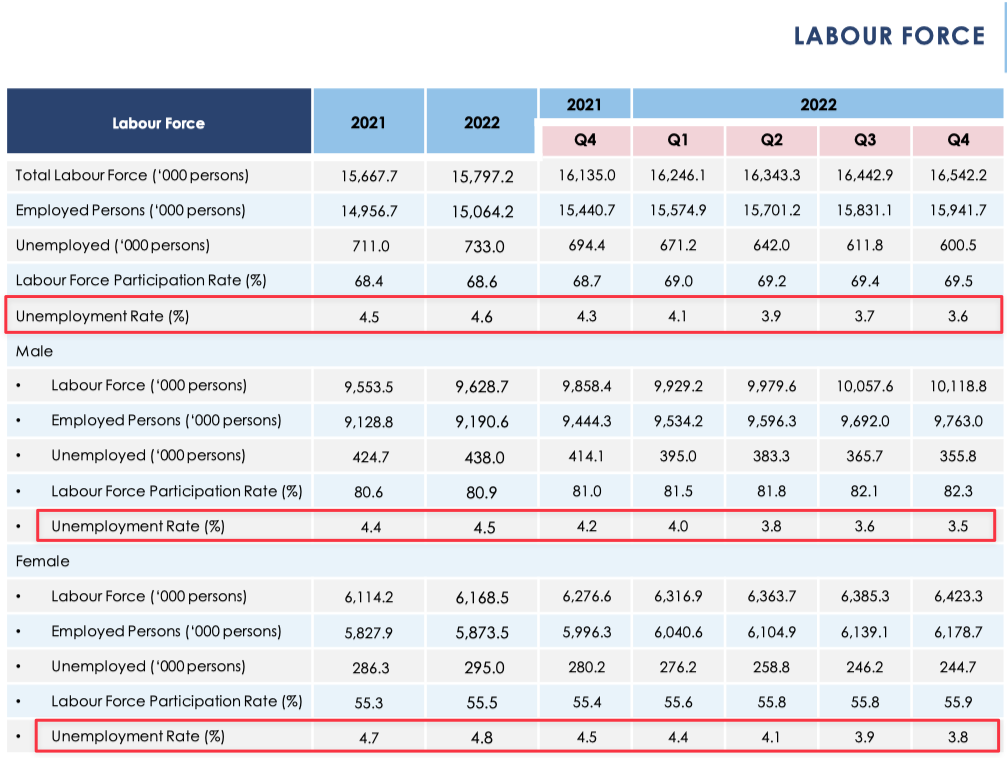
The above charts show Malaysia’s unemployment rate throughout FY2021 and FY2022. Once again, these charts need to be viewed through the lens of monetary policy for critical context — or more accurately, the neutral contribution by the latter to Malaysia’s inflation.
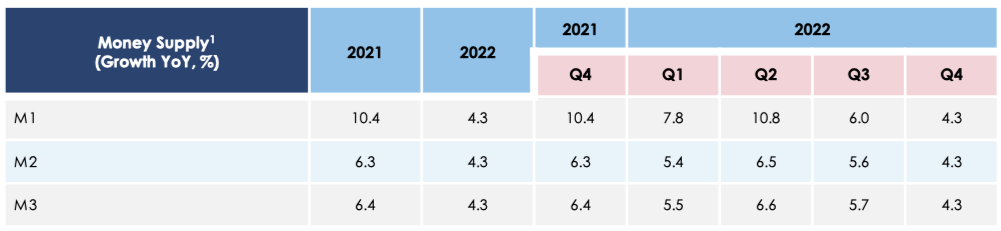
Fellow economists will understand what I mean when I say that there is little correlation over the past two years between the historical trajectory of Malaysia’s monetary policy vs its unemployment rate — and therefore limited insight to be drawn by looking at the charts & tables above. Money supply growth in Malaysia was not particularly onerous throughout FY21-22 considering the environmental context of the pandemic at the time, and I think we can genuinely afford to give the Malaysian central bank BNM a pass this time around.
The Value Investing Substack Portfolio Outperformed The S&P500 By Over +16.6% In 2022! Click the link below to find out more!

What Will Policymakers Likely Do In 2023? And What Will The Upcoming Budget 2023 Reveal on Feb 24?
So far, we have covered most of the economic context required in order to form our own conclusions on the likely trajectory of policymakers in 2023 — and most fellow economists can easily put the pieces together to form their own conclusion by now. However, I’ll be reserving my own thoughts on the matter (including what Budget 2023 will reveal) below only for paid subscribers.
The paid section of this macro report below will not count towards your monthly paid subscription quota — consider it as a gift from me to paid subscribers, as thanks for your generous support thus far! If you’re not yet a paid subscriber, do sign up for a free trial below!
Keep reading with a 7-day free trial
Subscribe to Value Investing Substack to keep reading this post and get 7 days of free access to the full post archives.