TSLA (Part S): Financial Statement Analysis (FY16-23)
2.5x ROA > Auto Industry Average. Now that's a "Margin of Safety".
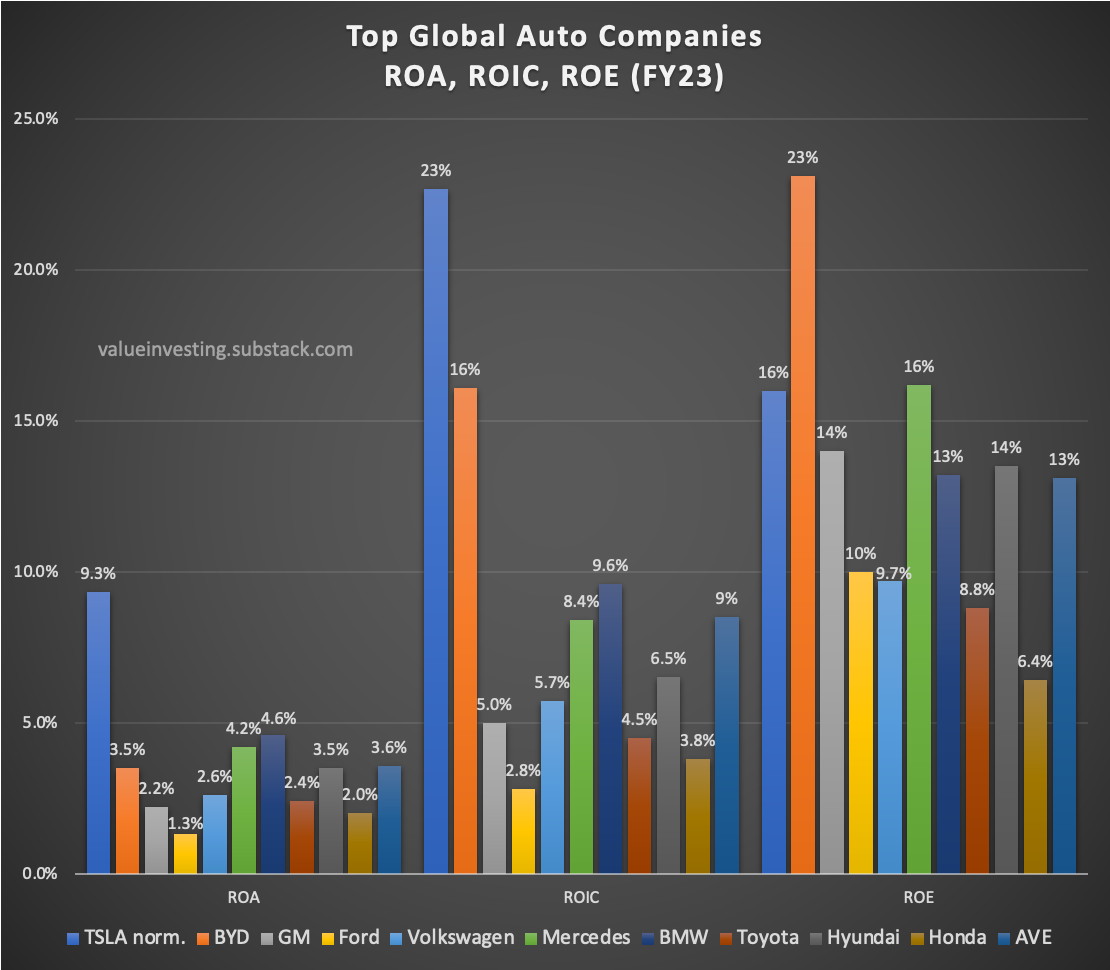
When I first saw the chart above, I couldn’t believe it at first and had to double check TSLA’s figures (left blue bars) against its traditional auto competitors. Their FY23 normalized ROA of 9.3% was 2.5x higher than the auto industry average of 3.6% (right blue bars).
Even BYD (orange bars), Tesla’s supposed archrival, only sports a 3.5% ROA. While that may not be an apples-to-apples comparison, it’s still worth noting that BYD was only able to match TSLA’s industry-leading ROE in the presence of excess leverage.
I have yet to do a detailed asset-level comparison across all auto companies, but a quick glance at TSLA’s balance sheet does not reveal anything drastically different about their asset base which might have contributed to such sterling ROA (aside from perhaps Giga Shanghai). Nor does the presence of their Energy business unit really move the needle, with Energy GP being nearly 15x less than Auto GP in FY23.
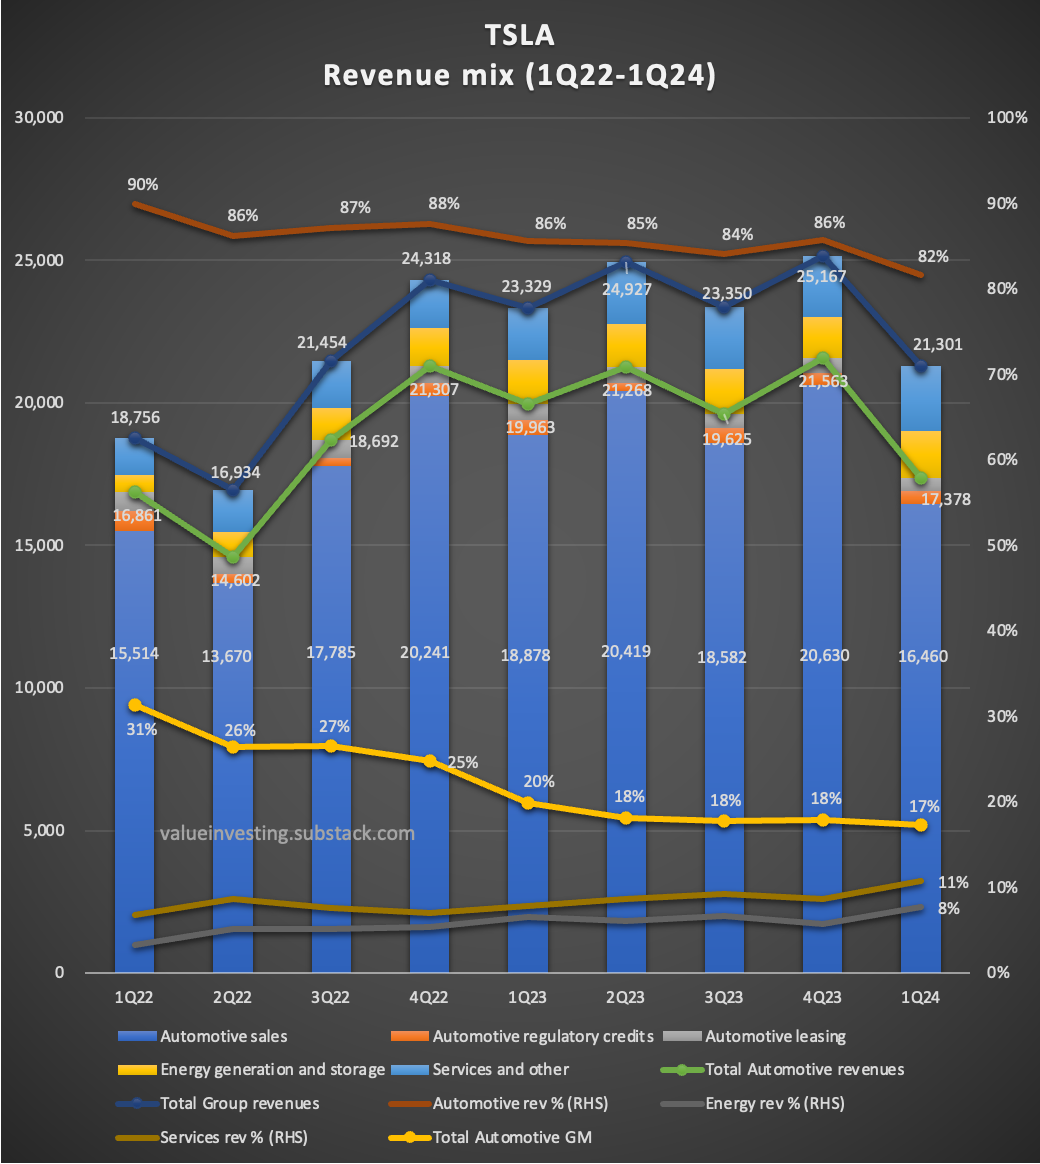
Some might be inclined to point out that TSLA is probably “cheating” on its ROA by outperforming on its auto leasing business and from regulatory credits. That’s not true either, with both combined only contributing to 5% of Total Auto revenue in FY23 (i.e. 95% from Auto sales).
And even if that were the case, General Motors and Toyota’s auto leasing revenues in FY23 (i.e. finance division) were 9% and 7.5% of Total Revenues respectively (>50% higher than Tesla’s).
As we shall clarify below, TSLA’s historical profit margins appear to be above board as well. Hence, Tesla’s ROA does appear to be legitimately earned.
Next week’s Part X report will be an Auto segment deep-dive — and will discuss historical Productions & Deliveries, as well as provide operational context from a business & industry perspective (e.g. Chinese EV competition). We’ll also compare the aforementioned financial metrics against those of TSLA’s competitors — to get a clearer sense of where Tesla’s sources of performance come from.
Today’s Part S report will focus primarily on three statement analysis, as it pertains more closely to understanding their longer-term historical performance (i.e. value investing).
Edit: In an earlier version of this article, I had accidentally posted this article with the subheading “3x ROA > Industry Average”. That was incorrect, as their FY23 results actually included a huge one-time tax income. I have since corrected it to a more accurate 2.5x — sincere apologies for the earlier error.
Table of Contents:

1. Let’s talk about Tesla’s Q1 results
2. Revenue — More Than Meets The Eye
3. Gross Margin Performance (FY16-23)
4. OPEX & Non-OPEX Performance
5. Balance Sheet & ROIC — 2.5x ROA > Auto Industry Average
6. Cash Flow Statement: Very Vanilla
7. 📊 TSLA 3-Statement Model - 15 original charts (download here)
8. 🤖 AI Article Summary (240 words)

In this article: 3,500 words (20 mins), 15 ORIGINAL charts. Don’t miss the full-fledged TSLA 3-statement model + 240-word AI summary at the end of this report!

Disclaimer: The contents of this document are NOT meant to serve as investment advice. Read our full disclaimers below.
Let’s talk about Tesla’s Q1 results
You’ve probably already heard about all of the disastrous news about TSLA that’s been coming out of the woodwork over the past month. In case you’d like a refresher, here they are in one list:
Chinese EV competition
US/EU auto import tariffs
Model 2 cancellation
FSD deferred revenues fraud
Acceleration of new model ramp
Robotaxis/autonomy
10% headcount reduction
Resignation of key executives
If you’d like more detail on any of these, there are others who can perhaps explain it better than me. For brevity’s sake, I’ll skip repeating them here.
Rather than take a magnifying glass to each individual quarter’s performance, it’d be more instrumental to take a longer-term view in assessing TSLA’s long-term performance by considering the wider secular trends impacting the auto industry — such as those that we had previously covered in Part 0.
Keep reading with a 7-day free trial
Subscribe to Value Investing for Professionals to keep reading this post and get 7 days of free access to the full post archives.


