Capital One: Berkshire's American Express II
The Most Comprehensive Capital One ($COF) Equity Research Report with a focus on analyzing its LT fundamentals & business prospects - the way Buffett might have seen it
HIGHLIGHTS:
$COF Bank Metrics At A Glance — FY22 ROA: 1.6%, ROE: 14%, ROTCE: 20%. LTD: 90%, LCR: 143%, NSFR: >85%. NPL: 0.43%, NCO: 1.36%. CET1: 12.5%, RWCR: 13.8%. Top 12 US Bank by Assets, Holds no HTM securities.
Sellside Consensus is Missing the Plot — Most $COF sellside reports are incorrectly extrapolating Capital One’s excessively high FY22 ACLs to mean that a significant recession lies in the bank’s horizon. However, the more likely possibility is that there is some kitchen-sinking activity going on (amidst FY21/22 blockbuster earnings), for profit smoothing in future years via recovery of past ACLs (historically ~30% recoveries).
FY22 earnings possibly understated by up to 40% — The Footnotes Analyst recently wrote about how over-conservative CECL accounting can cause accounting profits to significantly detract from real economic profits at large banks, due to the Day 2 effect. My upper estimates imply that FY22 earnings could be understated by up to 40%, due to this phenomenon.
Credit Card segment potentially has a mindblowing double-digit yield spread of 10.75% — Most mortgage loans have a post-impairment effective yield spread of about 1-2%. I demonstrate below how I arrive at my estimate of COF’s equivalent for their Credit Card segment of 10.75% — about 5x the yield spreads of the average US mortgage loan.
Detailed Fundamental Analysis of $COF — This report goes into an extreme deep-dive of Capital One’s historical financial statements and its LT business fundamentals. Most sellside reports merely focus on the next 12 months, and IMHO are missing significant perspective on COF’s longer-term prospects.
It is quite unlikely that you’ll be able to find a similarly detailed sellside report focused predominantly on analyzing Capital One’s fundamentals & business prospects from a LT perspective — the way Buffett would have looked at it. Sign up for a free trial below to discover it for yourself!
CHAPTERS (30 min reading time):
Business Segment Analysis — Plus Unpeeling Over-Aggressive CECL Accounting
Historical Trend Analysis by Business Segment — And Credit Card’s 10.75% Yield Spread
Capital One Valuation: 17.3% TSR? Nah, Just 15% — And “XX” Norm. PE ratio
Capital One: Business Analysis
In this section:
Buffett acquired nearly $1B worth of Capital One shares in May 2023.
FY22 Credit Card ACLs amounting to 7% of gross loans may be over-conservative, relative to FY22 segment NCO rates of 2.53%.
Top 23 US Banks all passed June’s Fed stress test with flying colors (COF: No. 12), which assumed a 40% decline in CRE prices — implying COF is prepared for any potential CRE refinancing storm.
Highlights from 1Q23 earnings call: Striking correlation between changes in unemployment rate vs. credit losses, risk-managed loan vintage composition, discussion of impacts from CFPB late fee proposal & Walmart lawsuit.
A lot has happened over the past year at Capital One COF 0.00%↑, the 12th largest US bank with a market cap of $44B. The SVB Financial Banking saga sent shockwaves throughout the entire US banking industry; Walmart sued them over a partnership breakup allegedly worth $1B; the incoming Office CRE tsunami expected to hit the banking industry’s shores; and the most hawkish Federal Reserve in modern history bent on hiking rates until inflation is tamed.
So markets were definitely taken by surprise when Berkshire Hathaway’s 13-F revealed in May that it had bought nearly $1B worth of COF 0.00%↑’s stock. This was perhaps informed by the fact that Capital One’s share price had declined by -25% since early-2023.
Having read through several sellside reports on Capital One from the bulge bracket investment banks, the overwhelming sense I got was that the bank was in a spot of trouble. Firstly, the bank had charged an excessive 7% of gross loans worth of ACLs to the bank’s crown jewel Credit Cards segment in FY22 — and in the wake of recessionary fears, implied that management themselves were expecting a significant credit crunch in the next two years. Secondly, markets were panicking that the Office CRE refinancing debacle could lead to systemic contagion across the domestic credit environment — and the fact that the Fed was still hiking in the face of deteriorating credit conditions wasn’t helping.
However, a closer look at the situation paints a potentially different picture for the business landscape. Firstly, the 7% of gross loans worth of ACL for the bank’s Credit Cards segment did not align with FY22’s NCO rate of merely 2.53% for the segment. It’s true that FY22 NCOs represented peak health credit cycle, but even then that seems like an excessive level of provisioning.
Secondly, an increasing number of market commentators are coming out of the woodwork claiming that Office CRE fears are overblown (I discuss this in last month’s EWBC 0.00%↑ equity research report). In June, the Top 23 US Banks passed the Fed’s stress test in June with flying colors — which assumed a calamitous hypothetical scenario of a global recession where CRE prices collapsed by 40%; a substantial increase in office vacancies; and a 38% decline in house prices. Capital One was No. 12 on the list — and besides, their Office CRE exposure represents just 1% of their total loan portfolio.
One thing which caught my attention in their recent 1Q23 earnings call was how they used the metaphor of “two humps of a camel” to describe the correlation between changes in the unemployment rate and Capital One’s credit losses. The whole section is worth a proper read, but the gist of it is this — during times of deteriorating credit conditions, higher charge-off rates take place which tend to improve the overall credit health of the post-recession loan portfolio. For instance, COF saw huge charge-offs during the GFC, but that was immediately followed by some of their best-performing years as their credit portfolio turned healthier — given that the remainder of the surviving credit card customers were the best paymasters within the loan portfolio. The implication here is that the recently deteriorating credit conditions could imply better times ahead for Capital One in the near-future.
The second thing which caught my attention was the description of the bank’s loan vintage performance. Basically, Capital One’s “original fintech” banking infrastructure (which was discussed in last week’s article below) has enabled them to proactively smooth out the possible future distribution of loan vintage-on-vintage performance — allowing new loan originations to smooth out older maturing vintages and diversifying credit risk across vintages. In layman’s terms, management has proactively implemented solid credit risk management which should mitigate potential losses in a recessionary environment.
Three other idiosyncratic events are worth highlighting. Firstly, there is the expected upcoming revision to the CFPB late fee proposal. Management responded that this could potentially significantly impact the bank’s Credit Card business segment, but stopped short of providing any guidance. Secondly, there was the Walmart lawsuit, in which management claims that any potential impact from losing the lawsuit would only affect bank earnings in 2025 at the earliest.
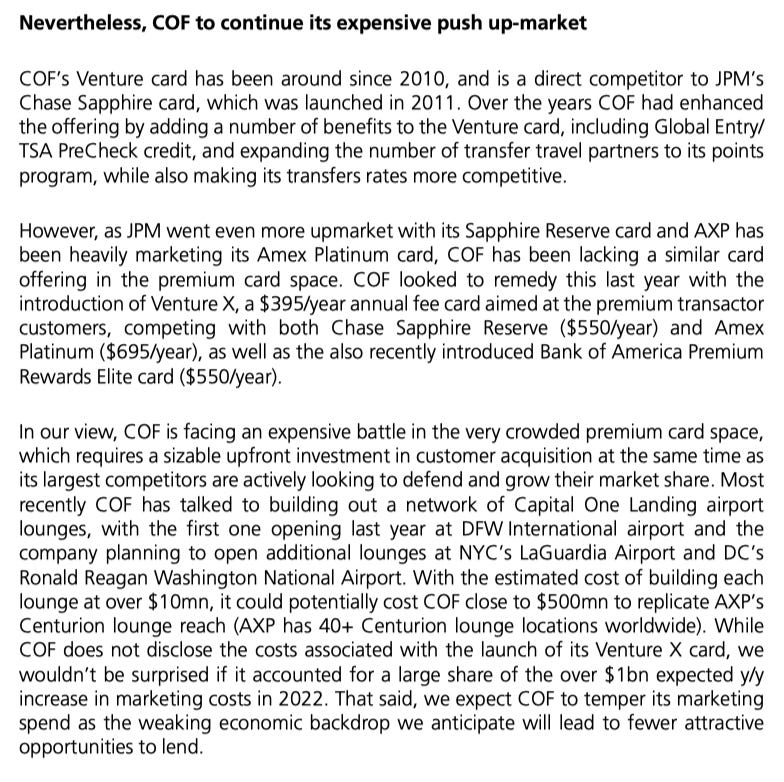
Thirdly, despite the ~30% subprime makeup of its Credit Card loan portfolio (defined as FICO score of <620), management has clearly stated their preference for moving upmarket by pursuing ‘transactor’ customers rather than ‘revolver’ customers in their latest FY22 Annual Report. The bank’s current efforts are being spent on grabbing market share from JPM’s Sapphire Reserve card and AMEX’s Platinum card in the premium credit card space, rather than in the mass market space. The following screenshots from UBS’s Initiation Report (dated 21 Nov 2022) provide more granular detail concerning this:
Finally, I would just like to opine that the vast majority of Capital One sellside reports I’ve come across are excessively focused on how its share price could perform over the next 12 months. And to be fair, that’s their job. However, going through my own financial analysis of COF 0.00%↑ made me realize how much was missing about Capital One’s long-term prospects from the target prices baked into sellside consensus.
This is why I described this report as being the most comprehensive Capital One equity research report catered toward analyzing its LT business prospects. And it’s what I imagine Buffett would have focused differently on instead before putting nearly $1B of Berkshire’s portfolio capital behind COF 0.00%↑.
Click the following pics for more on Capital One:
“This excellent article from The Footnotes Analyst demonstrates how over-conservative CECL practices can lead bank accounting profits to detract from real economic profits — and it’s possible that FY22 earnings could be understated by up to 40%.”
Capital One: Financial Statement Analysis
All FY22 figures:
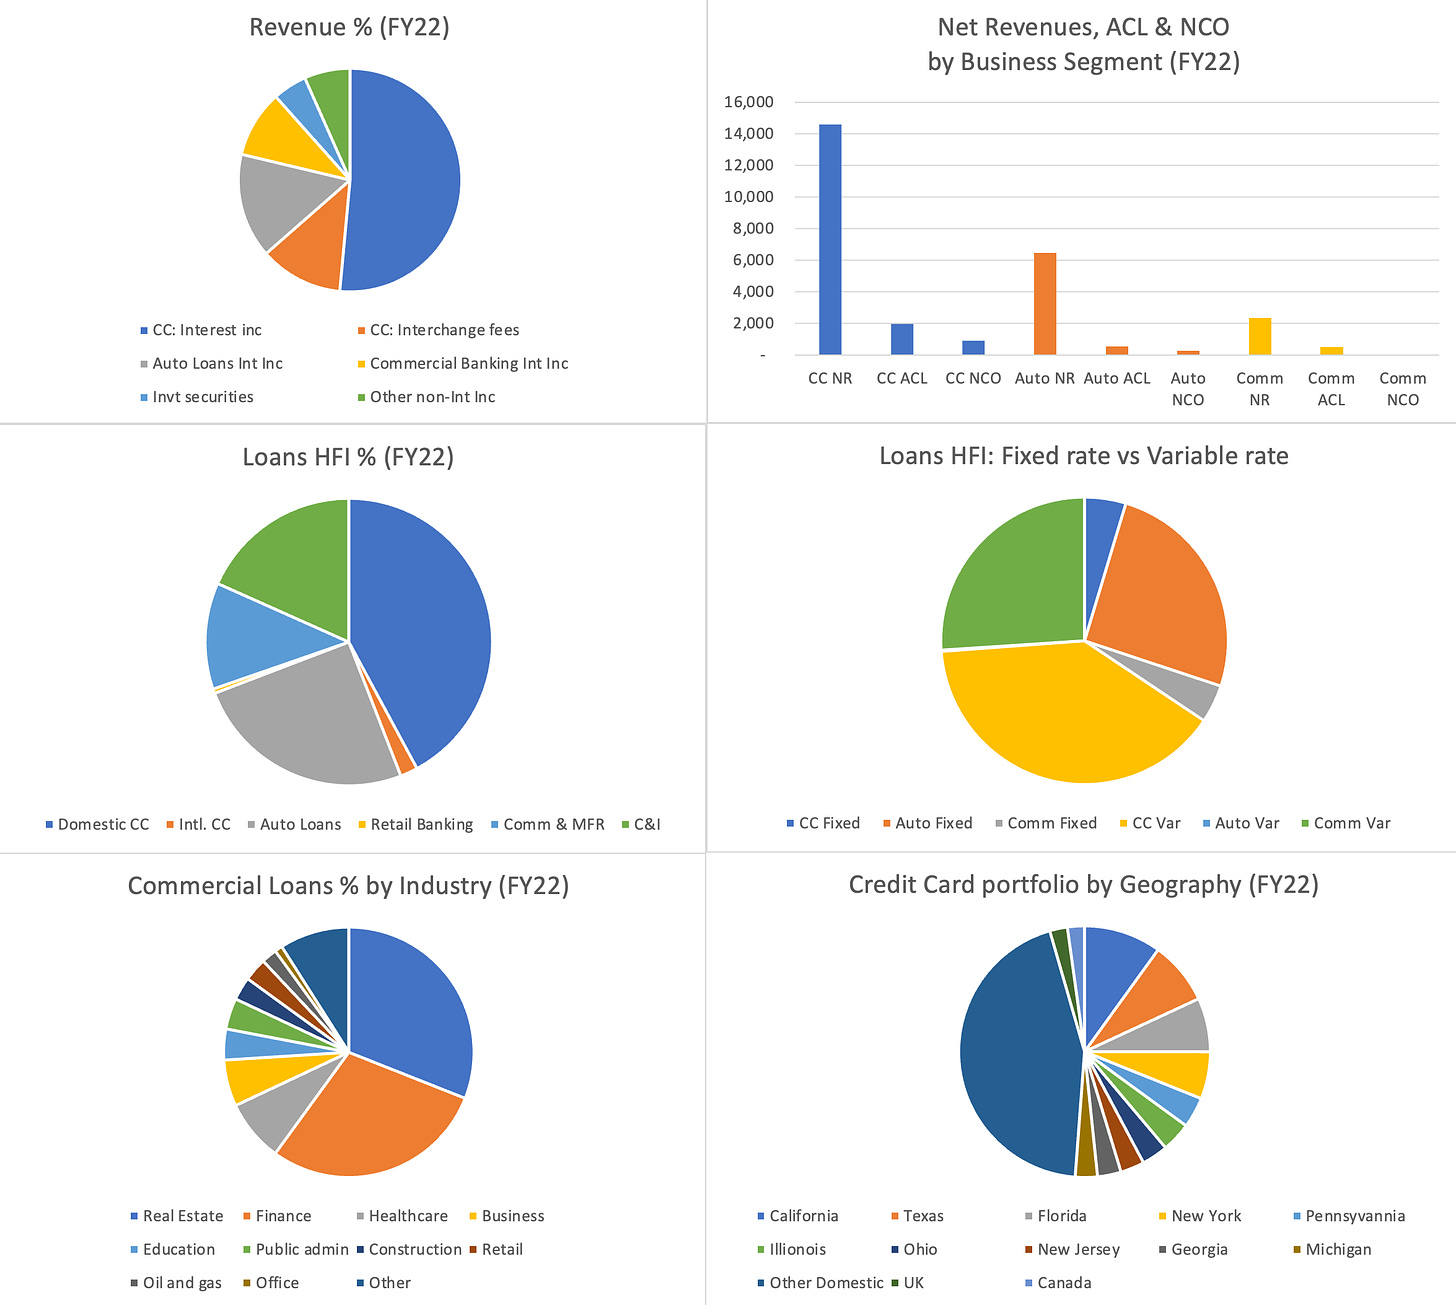
Capital One revenues — 45% Credit Card, 30% Auto loans, 25% Commercial Banking:1
Nearly ~100% of Credit Card revenues are from Domestic Card; and nearly all of Consumer Banking revenues come from Auto loans.
Commercial Banking revenues are split 40:60 between ‘Commercial + MFR’ loans & C&I loans.
Office CRE represents <1% of total loan exposure.
Office CRE loans are 2/3 concentrated in NY, DC and SF; and are split roughly 40:60 between Class A and Class B/C.
~30% subprime exposure in both their Credit card & Auto loan businesses2.
COF’s Credit Card business model bears striking similarities with AXP 0.00%↑:
45% of the former’s revenues and ~60% of the latter’s revenues come directly from Credit cards.
COF’s Card revenues are currently still ~100% Domestic; but may have high International revenue potential — similar to how Buffett saw KO in 1988.
~80% of Card revenues are sourced from Net Interest Income; only ~20% are from interchange fees. Makes it much closer to AXP 0.00%↑ than Visa/Mastercard. 3
Targets higher-income ‘transactor’ type credit card customers, rather than lower-income ‘revolver’ type customers.
COF is very much a bank — ~88% of its liability funding is represented by low-cost deposits4:
Average cost of deposits: 0.91%; blended cost of total interest-earning liabilities: 1.25%
Average yield rate (AYR) of Credit card: 16.21%; Auto loans: 7.18%; Commercial banking: 4.0%; total interest-earning assets (IEA): 7.68%
Net interest income spread: 6.43%, Net interest margin: 6.67%
* Click on footnotes for the 10-K notes page numbers. Footnotes are best viewed on the mobile browser, as the Substack app still hasn’t been optimized for footnotes yet.
* Tip: Use Ctrl-F in this article in browser to search for specific banking industry data (e.g. “NCO”)
Commentary:
Keep reading with a 7-day free trial
Subscribe to Value Investing for Professionals to keep reading this post and get 7 days of free access to the full post archives.


