

VLRS: The Next SEA Ltd? (Part 2)
VLRS: The Next SEA Ltd? (Part 2)
15% Revenue CAGR at a normalized P/E of 6.8x


“I’d be curious to see if anyone thinks that VLRS can’t sustain at least 1% normalized Net Margins over the long-term. It would take a heaping scoop of cynicism to imagine them being loss-making into perpetuity.”
Not too long ago, I wrote about SEA Ltd, whose e-commerce arm Shopee was the regional No.1 player in a commoditized industry in a fast-growing emerging market economy.
As my earlier article titled “Is Mr Market Stupid?” describes, consensus valuations had over-attributed poor business optics — while completely ignoring its fortress balance sheet, robust cash flows, long-term secular tailwinds, and how its No. 1 industry position gave it the economies of scale to become the Walmart of its industry.
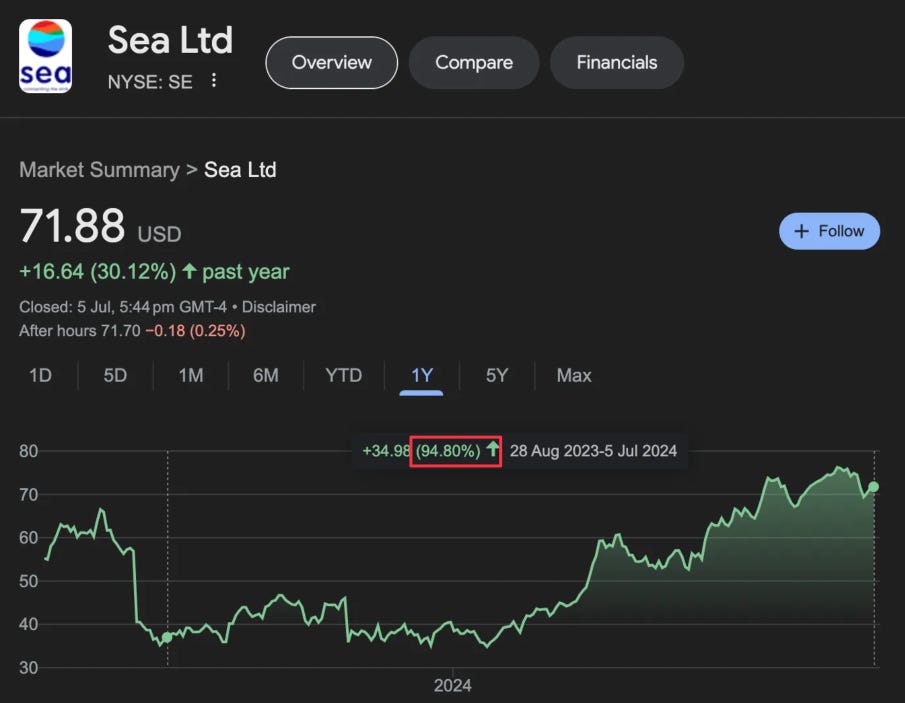
Within a span of 6 months, management recognized the poor market optics in prioritizing growth over profitability and dramatically curtailed S&M spend. This improved visibility of their organic ex-growth profitability, causing analysts covering SEA Ltd to re-rate its valuations and sending its stock price to nearly double within less than a year:
Mexico’s No. 1 LCC, Volaris Airlines (NYSE:VLRS) appears to be in a similar setup today. Let’s do a count of the number of similarities between SEA Ltd in Aug 2023 (when I wrote my first SE article) and VLRS today:
Like SEA Ltd, its share price has crashed by 70% from its peak achieved in 2021.
Like SEA Ltd, its the No. 1 player in a commoditized industry of an emerging market — giving it the necessary economies of scale to achieve the lowest unit costs, and thus give customers the best prices.
VLRS is the largest LCC of Mexico, sporting a lower RASM than Aeromexico’s CASM.
This means that VLRS’s unit revenues are lower than Aeromexico’s unit costs, implying that they have even lower unit costs.
Like SEA Ltd, it is also the largest player in a 3-player oligopoly of a consolidated commoditized industry, where economies of scale rule supreme.
Like SEA Ltd, it has a fortress balance sheet, a Net Cash position (ex-leases) and robust cash flows to defend against any reasonably possible cash flow risk.
Like SEA Ltd, its industry TAM has very long-term secular tailwinds with a highly visible growth runway. For context, their revenues have grown by 15% CAGR over the past 5 years.
Like SEA Ltd in Aug 2023, VLRS’s valuation today appears to be significantly discounting longer-term growth due to short-term operational challenges.


Ultimately, this boils down to Margin of Safety — which once again, is similar to how I described SEA Ltd. Recall that at the time of my SE article above in Aug 2023, SE 0.00%↑ was trading at a mere 12.5x normalized P/E and had a massive margin of safety built into its valuation, considering everything I’ve discussed above.
On the surface, VLRS today looks like exactly the same setup — except it’s trading at an even lower 6.8x normalized P/E. This VLRS Part 2 report will do the deep-dive for you so that you don’t have to.
Check out our previous articles:
VLRS: CASM Deep-dive

VLRS Part 2 report: Table of Contents

1. CASM Deep-dive
i. Analyzing Historical Fuel Cost Performance
ii. Fleet age
iii. RASM vs. CASM performance (2017-2023)

2. Estimating Normalized Net Margins

3. Fortress Balance Sheet + Robust Cash Flows
i. Debt serviceability
ii. Historical OCF consistently > historical profits
iii. ROIC performance

4. Valuation

5. 📊 VLRS 3-Statement Model (download here)

Disclaimer: The contents of this document are NOT meant to serve as investment advice. Read our full disclaimers below.Analyzing Historical Fuel Cost Performance
Airlines are famously known for their high operating leverage — which is why fuel expenses usually occupy the attention of most airline industry observers.
The chart below breaks out their Expenses by type, as a % of revenues:
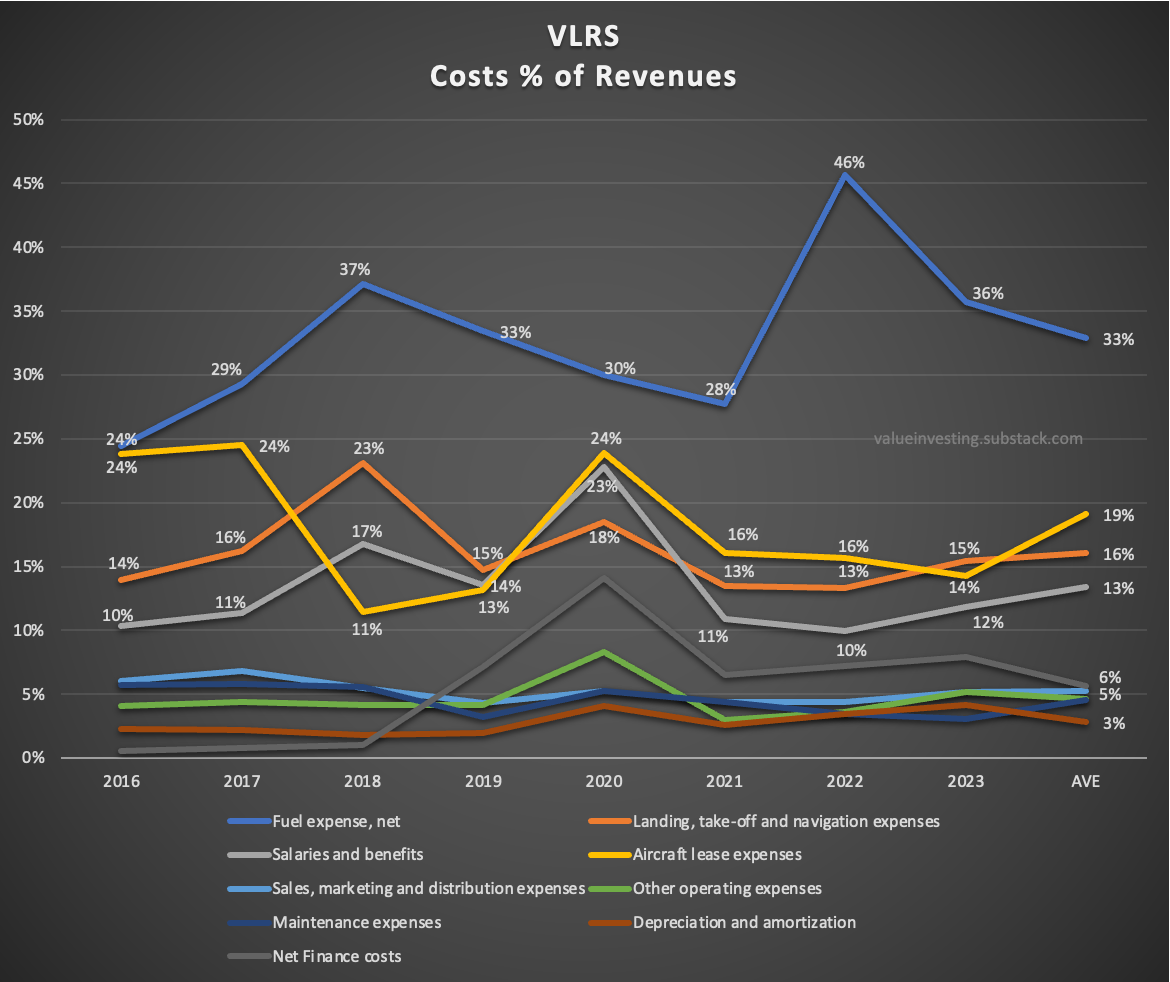
If you compare the annual fluctuations of each cost component to their LT averages (rightmost), you’ll see that most of them are pretty stable over time — with the only exception being fuel expenses (blue line), which sports relatively high volatility.
This implies that outside of fuel costs, most of VLRS costs are more or less “fixed” in nature, and thus can be treated as a fixed normalized % margin in our valuation model.
The chart below demonstrates the correlation between VLRS’s unit fuel costs and Brent oil prices since 2017:
Keep reading with a 7-day free trial
Subscribe to Value Investing for Sophisticated Investors to keep reading this post and get 7 days of free access to the full post archives.