
✨ BJCORP Accounting Deep-Dive - Part 3a: Profit & Loss Statement
An excessively detailed deep-dive of BJCORP's historical Profit & Loss Statements over the past 10 years

This is the 1st part of a 4-part series to BJCORP Part 3, which will be released over the next 3 days (edit: next week) - i.e. Part 3b, Part 3c, and Part 3d.


BJCORP’s consistently negative PATAMI can be mostly attributable to its high non-deductible tax expenses owing to high NCI representation - rather than their business being in secular decline.
We shall be taking a deep look at some of BJCORP’s potential problem areas in their Profit & Loss statements over the past 10 years.
By the end of this report, you should be able to unpack their web of entangled profits - and also identify which line items to pay special attention to in their future Profit & Loss statements.
Over the
next 3 days(edit: next week), I will also be releasing similar lengthy reports covering their Balance Sheet, Cash Flow Statement and those of their listed subsidiaries - as well as pulling everything together to explore how BJCORP might achieve its legendary 3,000% upside.
In my previous two reports about BJCORP, I laid out the investment thesis for BJCORP today. In case you’ve forgotten, I mentioned in Part 1 how the conservative base-case scenario is that:
if BJCORP successfully pulls off its turnaround; and
manages to attain a 10% ROE and 10x PE after 5 years
… the implied upside is 3.2x from its current share price of RM 0.25, i.e. a 5-year CAGR of 45%. You can read the full thesis in Part 1 by clicking the link below, or obtain a 30,000 feet view of the respective listed companies residing within the Berjaya Group in Part 2:

In this Part 3a report, I will be doing an accounting deep-dive to provide additional detailed context about what you’re getting yourself into if you invest decide to in BJCORP today. The reason why it is Part 3a rather than Part 3, is because Part 3 is going to be a monster report split into 3 sections - i.e. Part 3a, 3b, 3c - and culminate in the conclusion, which is Part 4.
In Part 3a to 3c, we will be covering in a high level of detail the Profit & Loss Statement, Balance Sheet and Cash Flow Statement of BJCORP respectively. In Part 4, we’ll also do an abridged version of the 3-statement analysis for the BJCORP listed companies relevant to this investment thesis, as well as expound on the potential 3,000% upside which we discussed in Part 1.
And here’s the best part: I have already completed the entire analysis, and all that’s left is for me to type it out… so I shall be releasing Part 3b, 3c and 4 over the next 3 days - one report per day! (edit: I know I promised one report/day earlier, but I’ve tried my level best to meet that expectation - and it still seems like I can only realistically type out and edit one report per 2-3 days. Sorry for overpromising earlier.)
The only reason why I’m releasing it in four parts like this is because there is simply no digestible way to consume the entirety of Part 3 in one go. You shall see why as you read through this 4,000-word Part 3a report - which focuses exclusively on the Profit & Loss statement.
Coincidentally, it also happens to be Christmas… so this is my Christmas gift to you, I guess? Merry Christmas!

This report is going to be extremely picture-heavy, as I will be judiciously utilizing screenshots from BJCORP’s annual reports to convey the accounting narrative. I have also attached the 10-year financial model of BJCORP’s historical Profit & Loss statements [download link below], and would recommend that you download it and keep it opened side-by-side as you read through it this report - so that you can follow the accounting narrative as I expound on it.
Also, feel free to perform your own analysis using my financial model in order to arrive at your own conclusion (which could very well end up being different from mine). If you find anything off, please feel free to let me know in the comments section below by clicking here.
BJCORP Links:
Company’s historical financials on TIKR (free sign-up required)
BJCORP’s Listed Companies’ Information & Financials:


BJCORP 10-year P&L Statement Model
Download my Excel financial model by clicking the link below:

Caveats:
The inputs for this financial model were entered into Excel by hand. As a result, there may be mistakes and slight inaccuracies with some of the numbers - mostly due to restatements in future reporting periods which I may have missed by using earlier annual report; but also possibly due to my own human errors. I’ve done my best to comb through the entire model to spot inconsistencies, but there will inevitably still be mistaken entries inside - as it would take me way too long to double-check every single figure for inaccuracies with a fine-toothed comb.
Thankfully, I’ve noticed that most of these errors were within 5% of the actual figures, and mostly corrected the rest. Since this investment thesis assumes a 300% upside for the base-case scenario, there should be sufficient margin of safety to absorb 99% of the mistakes made in this model. However, I would still like to apologize in advance for any gross inconsistencies remaining, and hope you can point them out in the comments section below so that I can edit them for everyone’s benefit. Many thanks.
For context, I’ve highlighted in yellow the potential problem areas inside the financial model. While I will be providing an explanation for most of them, I will also be ignoring some of them (e.g. the ones from a decade ago) for the sake of brevity. If you have any questions about any particular area, feel free to ask about them in the comments section below so that I can provide a more personalized explanation to your particular areas of concern.
Profit & Loss Statement (PL)
Headline Profit & Loss Statement Analysis
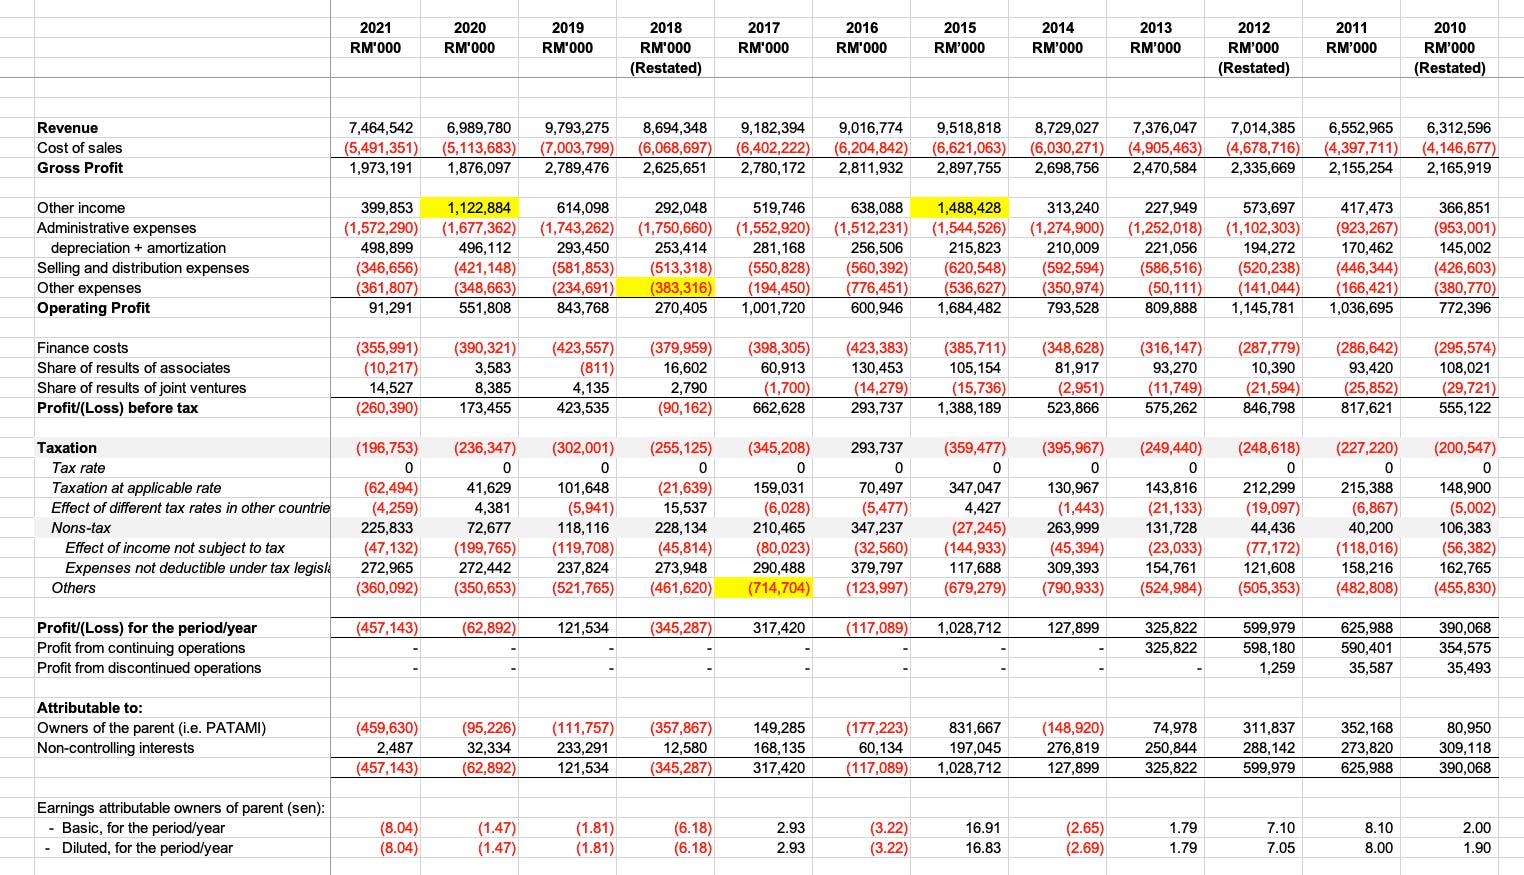
Perhaps the first thing to catch your eye in the above financial model is that BJCORP has been consistently delivering a negative Profit attributable to owners of parent (or “PAT after minority interests”, i.e. PATAMI) over the past half-decade. This is consistent with its dismal share price performance over the same period, which has delivered a mere 3.6% CAGR to its shareholders over the past 15 years.
However, the next thing that might catch your eye is that despite BJCORP’s regularly scheduled negative PATAMI, it has actually been delivering a positive PBT over the past 5 years (except in 2018). Which means that the company is loss-making primarily due to its tax expenses. How odd, right?
The main reason for this is because BJCORP has significant representation among its Non-controlling interests, as can be readily observed above. For the uninitiated, the Non-controlling interests here represent the other shareholders of BJCORP’s subsidiaries (e.g. BJFOOD, BJLAND) whose shares are not owned or controlled by BJCORP itself.
Due to the nature of consolidation accounting, the financial statements of its subsidiaries are merged into BJCORP’s own financial statements up to the PAT level - after which the PAT attributable to Non-controlling interests is then subsequently backed out at the end to arrive at PATAMI. Hence, only the Profit attributable to owners of the parent (i.e. PATAMI) belongs to BJCORP’s shareholders.
As we can see above, BJCORP splits its PAT quite generously with its Non-controlling interests (NCI). This means that while it does own over 50% of its subsidiaries in order to be able to consolidate their financial statements, it likely doesn’t own anywhere close to 100% of them. This is apparent in the screenshot of the Berjaya Group’s corporate structure below, which can also be found in my Part 1 report:
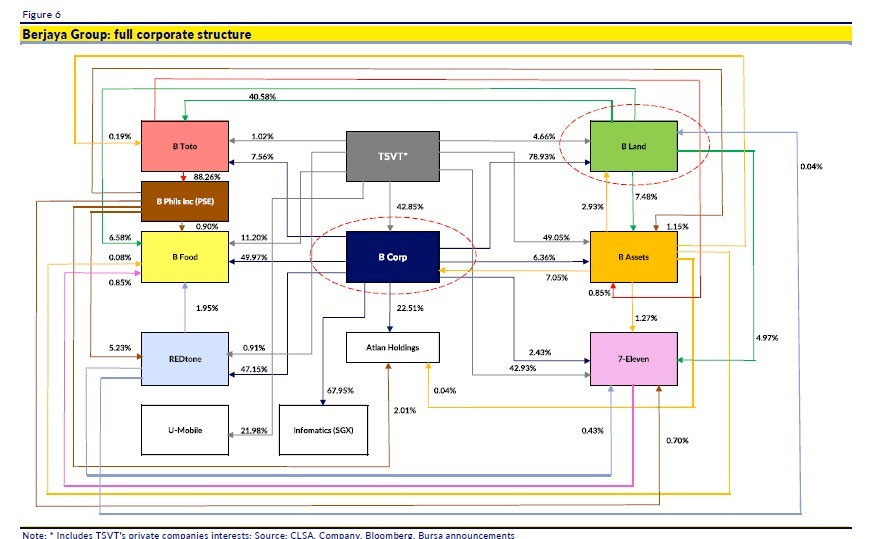
Since BJCORP’s PBT represents the consolidated PBT from all of BJCORP’s subsidiaries, it would naturally not be allowed to deduct the tax expenses attributable to the Non-controlling interests of its subsidiaries, in deriving its PAT and PATAMI. Hence, as you can see in my PL financial model above, I have segregated out the relevant non-deductible tax line items described - i.e. Effects of income not subject to tax and Expenses not deductible under tax legislation - which I have endearingly termed “Nons-tax”.
This Nons-tax figure represents the net amounts of the aforementioned two line items - which basically refers to the net non-deductible tax expenses of BJCORP, for the reasons described above. Examples of Nons-tax can involve different tax laws in different business jurisdictions, or just plain vanilla non-deductible expenses under the tax code which its subsidiaries are subject to.
These non-deductible Nons-tax amounts have to be backed out from the PBT before arriving at PAT, and the uneven distribution of the PAT between shareholders and NCIs is made further pronounced in arriving at PATAMI. This results in PATAMI being consistently in negative territory, despite PBT being consistently profitable - with BJCORP’s shareholders absorbing most of the losses. We can also observe this phenomenon in the Appendix section below, as demonstrated by how much more closely aligned the (PBT - Nons tax) amounts are to the PATAMI figure, in contrast to PBT :
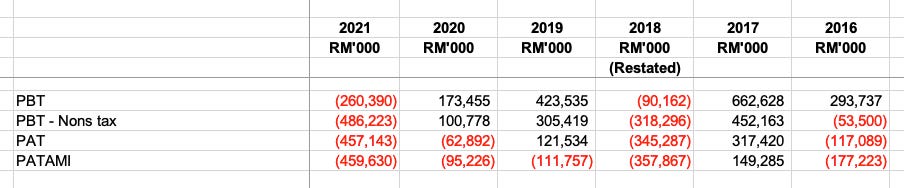
Hence, to wrap up this section, BJCORP’s shareholders have been consistently holding the bag for the past half-decade, largely owing to non-deductible tax expenses resulting from large Non-controlling interest representation in its subsidiaries. In other words, the business operations of BJCORP itself is actually holding its head above the water line, as shown by its consistently positive PBT over the same period. This is not a business in secular decline.
Merry Christmas SALE! Get more ASEAN stock ideas like this and access to all our previous research reports… for 10% off at only $79/year!

Profit & Loss Deep-Dive Analysis
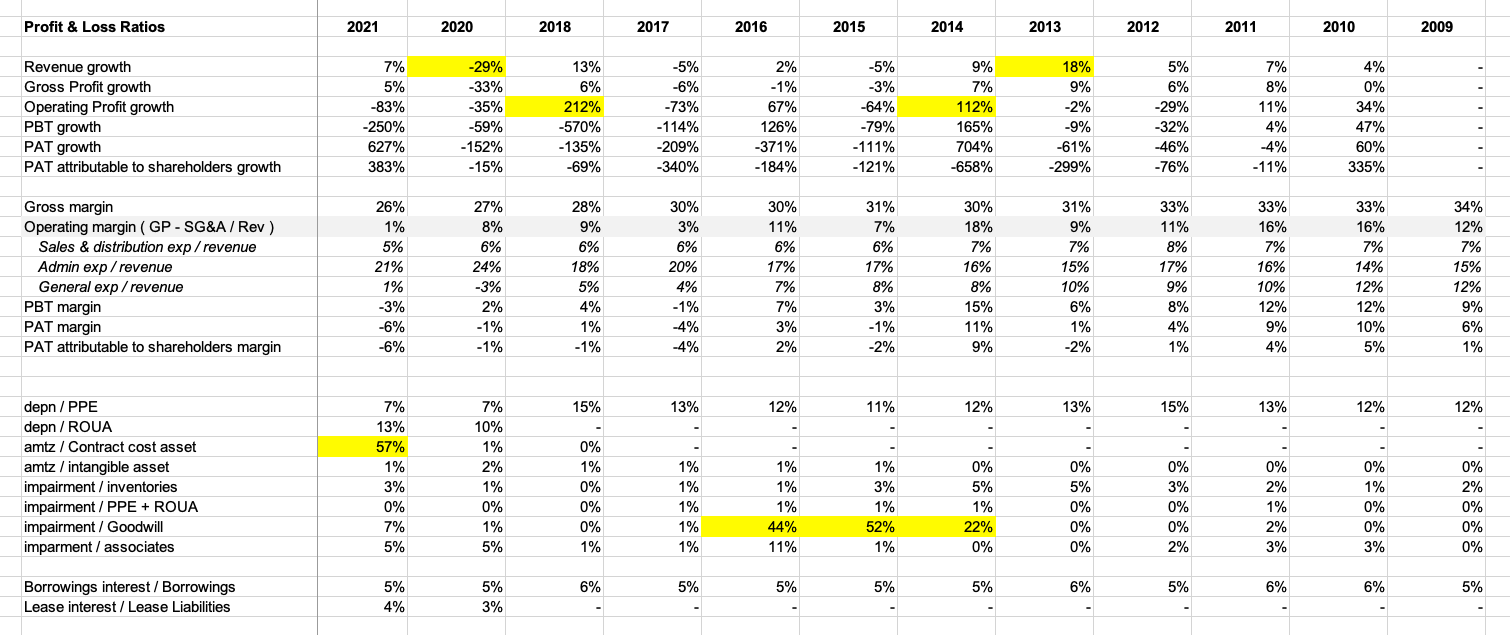
In my opinion, the easiest way to cover a broad swath of financial data over long time periods (as in this 10-year financial model) is via margin analysis. Basically, what this involves is identifying certain key operational factors that you want to analyze (which you’ll learn to pick out from experience), and divide two or more line items which represent those KPIs by each other to determine the performance of that KPI over time. A good example is the Cash conversion cycle (CCC), which very quickly gives you a snapshot of the health of a particular business’s working capital position over time.
As you can see from the screenshot above, most of BJCORP’s Profit & Loss KPIs are actually fine. Obviously, no analysis of BJCORP is complete without mentioning how they have had basically zero Revenue growth or Profit growth (i.e. PBT, PAT or PATAMI) over the past decade. In fact, perhaps the nicest thing you can say about them is that at least they haven’t been deteriorating too badly since 2010. There’s actually a very good reason for this incredibly flat performance over time - as we shall see when we analyse their Cash Flow Statement (CFS) in the Part 3c report, coming out within the next week.
Aside from that, there doesn’t seem to be many outstanding issues from simply observing their Profit & Loss ratios in the table above. Everything seems to be status quo here - with Interest rates on borrowings & leases looking normal; while Depreciation & Amortization does have one standout area in FY21, i.e. Amortization of Contract cost assets being 57% of carrying value. But since the carrying value of Contract cost assets on BJCORP’s balance sheet is negligible relative to Total Assets (0.5% in FY20), we can safely ignore that anyway. Impairments of Goodwill does show some potential problem areas, with relatively high impairments being recorded in between FY15-FY17 - hence we shall be giving them some extra attention below.
Regardless, the fact remains that BJCORP has not been performing whatsoever for the past 10 years. Yes, it’s true that their historical Gross margins at 30%, Operating margins at 10% and Net Profit margins at 0% don’t throw up any red flags - but that’s not really saying much when shareholders basically have been getting absolutely zero return on their investment for the past 10 years.
However, duty still requires us to have a look at the potential problem areas of their PL, which are highlighted in yellow below. Since the headline PL doesn’t provide sufficient granularity to address our concerns, I’ve also done a separate historical model which lays out each year’s Note 33. Profit/Loss before tax from BJCORP’s annual reports of the past decade, as screenshotted below:
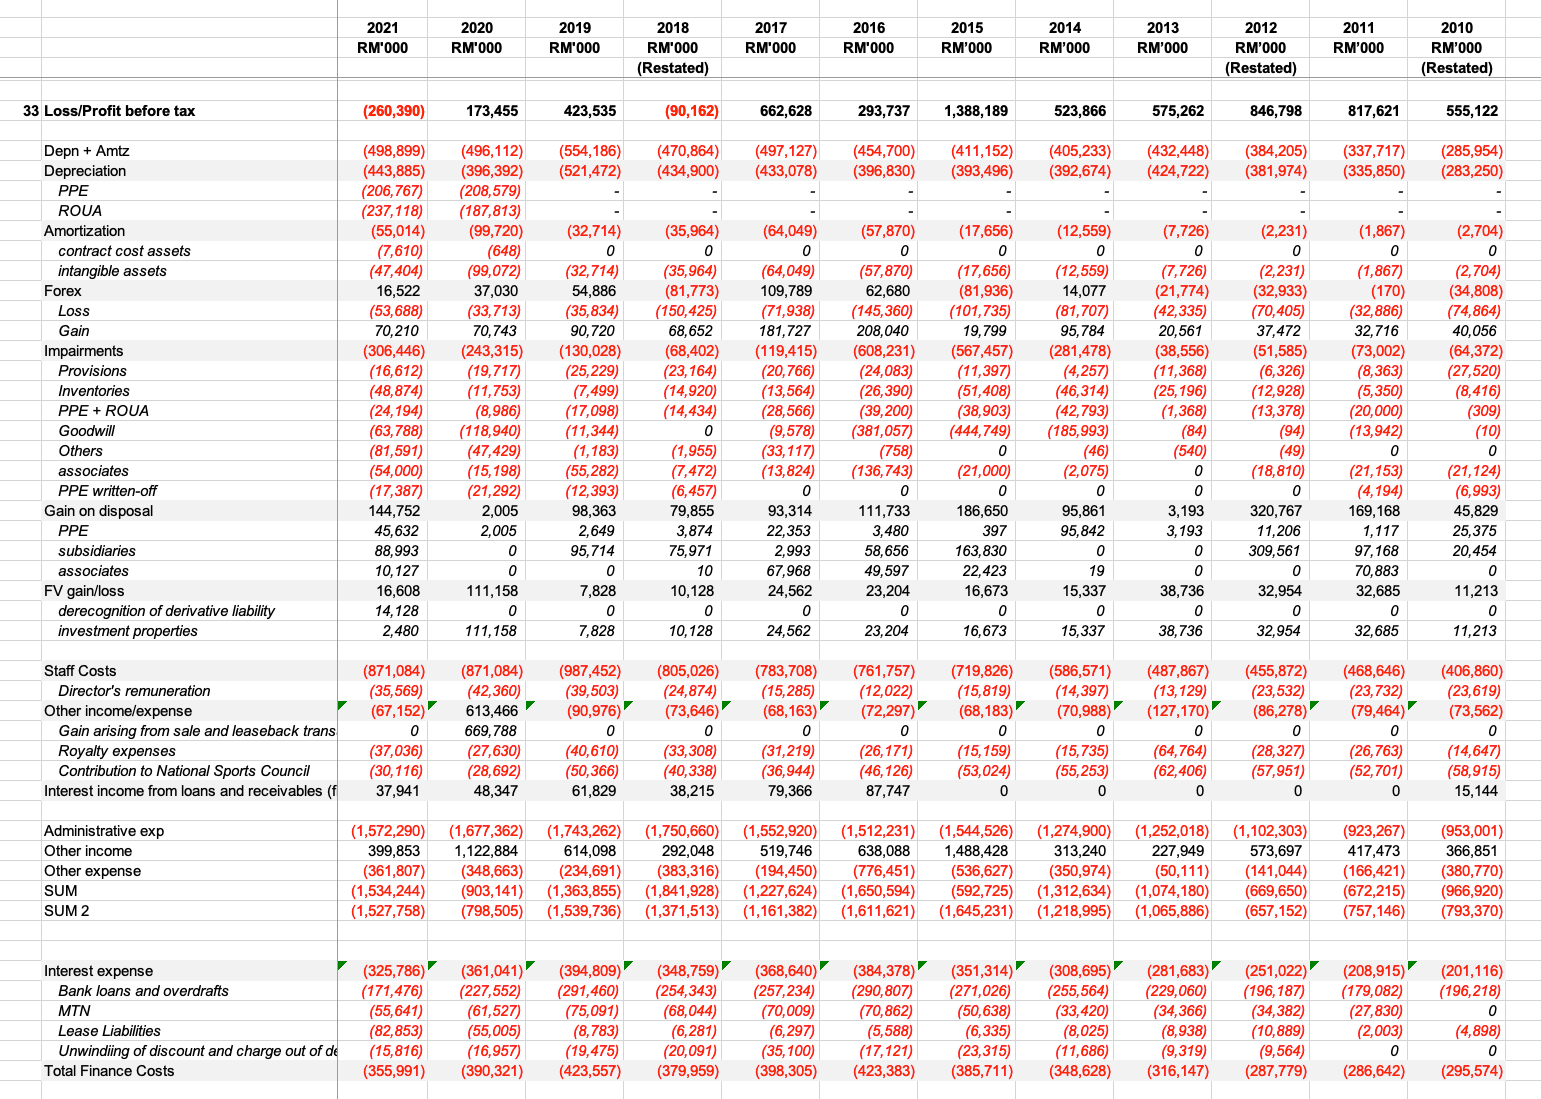
Let’s go through the relevant potential problem areas one by one below.
Click the button below to get a FREE 30-day trial and read the rest of this 4,000-word report!

Keep reading with a 7-day free trial
Subscribe to Value Investing Substack to keep reading this post and get 7 days of free access to the full post archives.